- Search Forex Factory
- 274 Results (3 Threads , 271 Replies )
- Hurst replied Jan 31, 2024
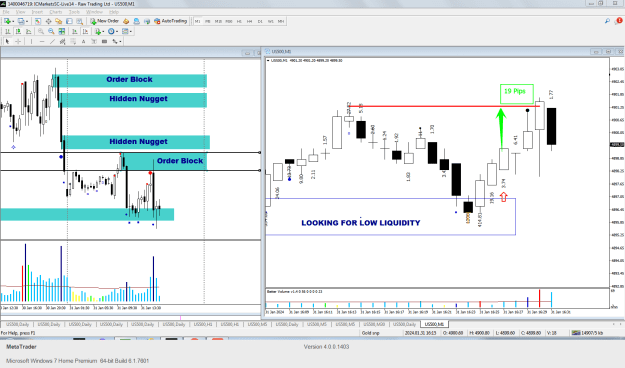
image 19 stress free pips in 3 mins
Predicting the sp500 on the hourly chart
- Hurst replied Jan 31, 2024
After many years of trading, in the search of the perfect indicator, finally we have made it. I know a lot of you are not making money trading, well I can put a end to that. In the next couple of days I will show you a cast iron system of trading, ...
Predicting the sp500 on the hourly chart
- Hurst replied Nov 14, 2023
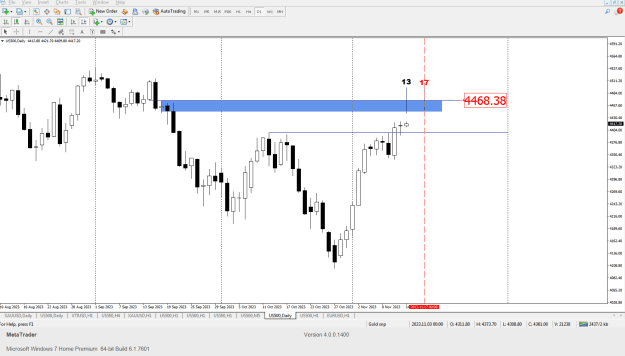
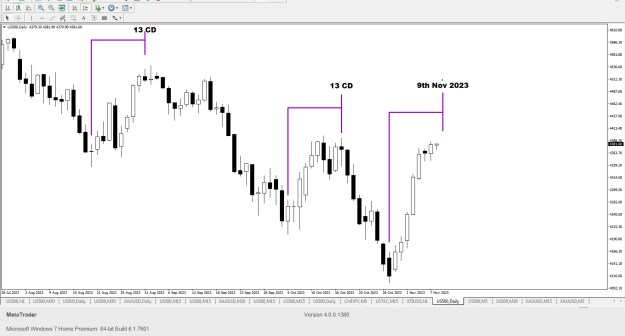
Sadly, the SP500 did not stop at the ideal retrace level, so now we start the count again. The SP500 is on day 13 from the last low on the 27.10.2023. On the 17th of Nov the move will be 21 calendar days from the low. Although the price action today ...
Predicting the sp500 on the hourly chart
- Hurst replied Nov 9, 2023
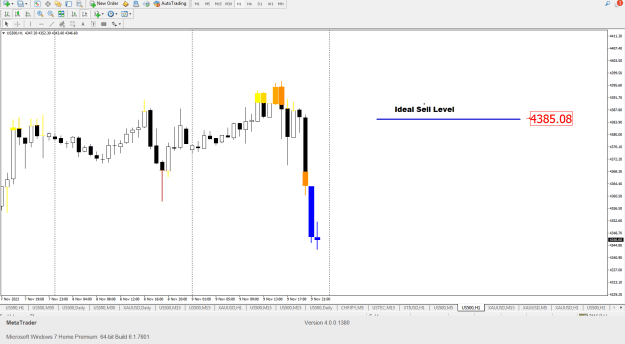
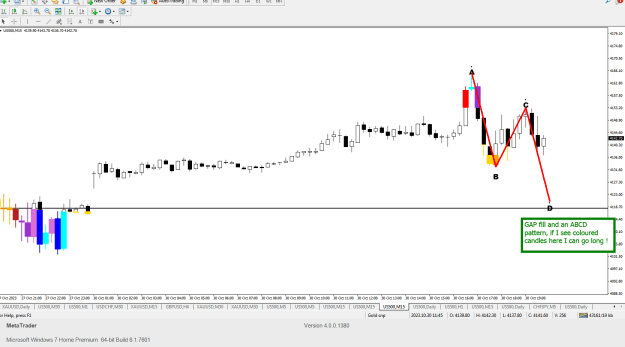
Here would be the ideal short level for me, now we simply wait for the indicator to form coloured bars and we can then refine our entry level image Of course with the indicator showing at the low, you realise the downside is limited.
Predicting the sp500 on the hourly chart
- Hurst replied Nov 9, 2023
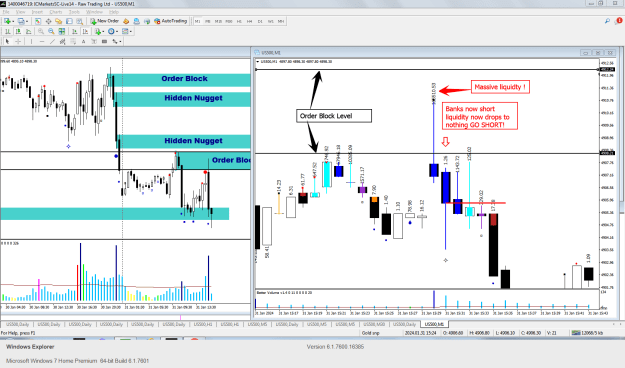
I spoke to soon it looks like the turn came in late in the US session. Now, I need a retrace and the indicator will help with that. image So, historically the indicator shows where the market makers are going in, very easy now to look at the ...
Predicting the sp500 on the hourly chart
- Hurst replied Nov 8, 2023
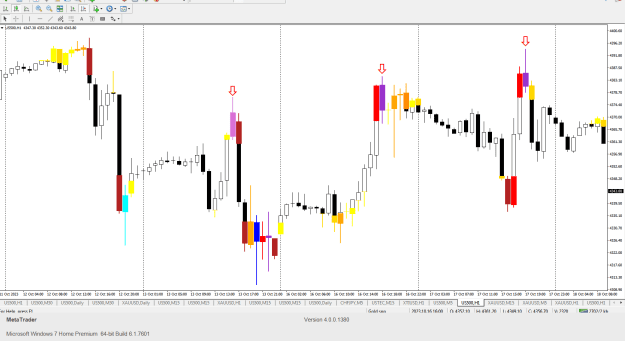
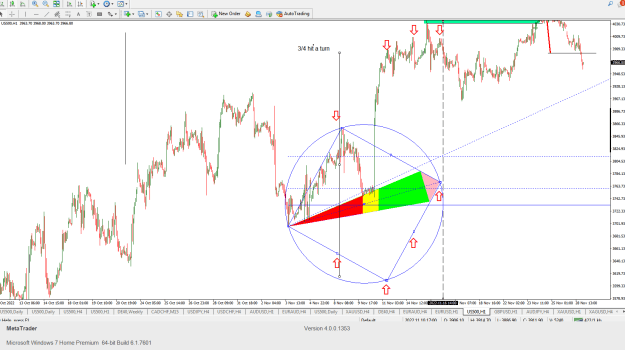
8th Nov 2023 SP500 Outlook Judging by the activity of the big players the SP500 is a couple of days away from making a top. image Using a nice timing method I learnt, my estimation is that the SP500 will run up for 13 day from the last low. This ...
Predicting the sp500 on the hourly chart
- Hurst replied Nov 1, 2023
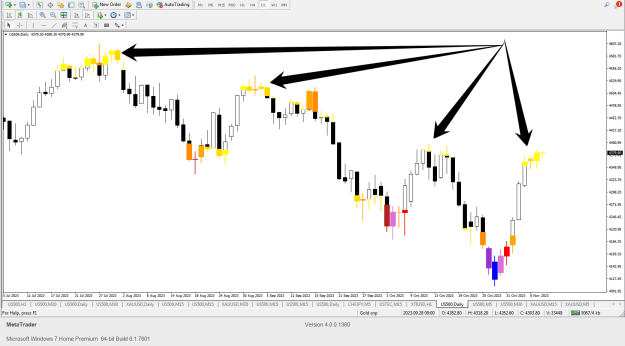
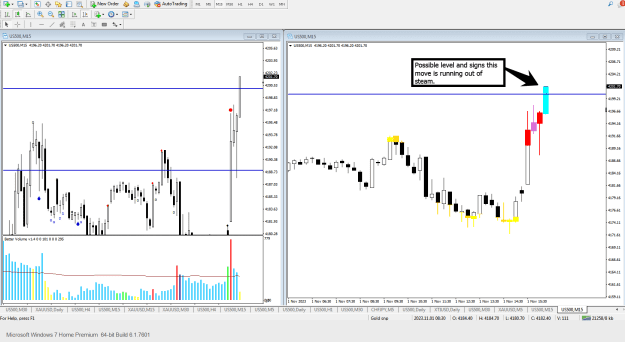
image Currently the SP500 is looking like it may well be running out of steam.
Predicting the sp500 on the hourly chart
- Hurst replied Oct 31, 2023
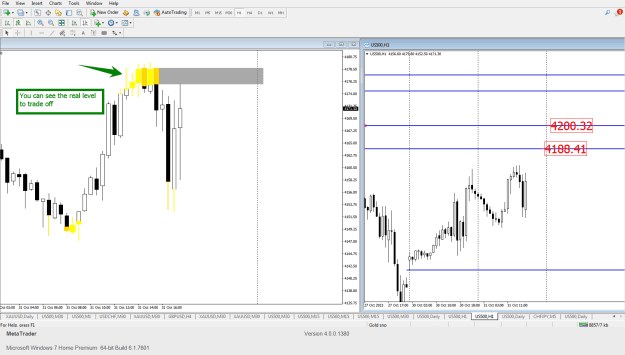
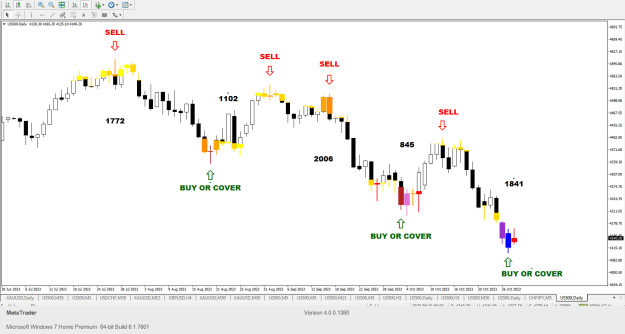
image The indicator has a great ability to show you the exact buying and selling levels within the candles as well.
Predicting the sp500 on the hourly chart
- Hurst replied Oct 31, 2023
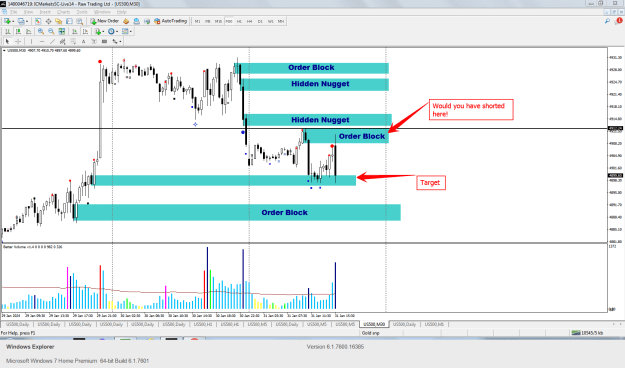
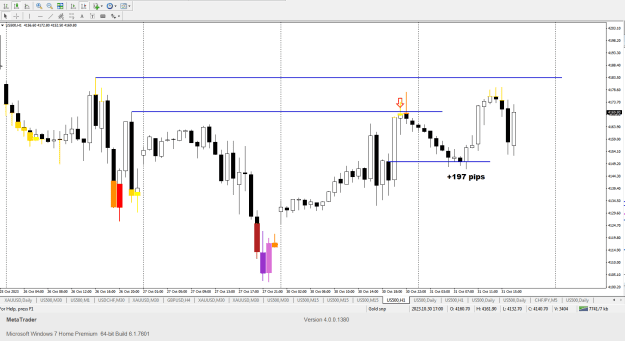
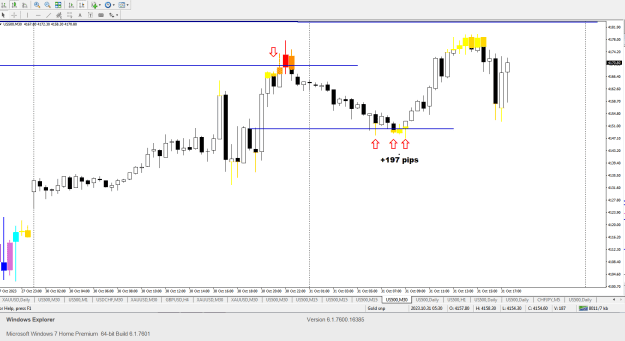
197 pips on that trade image so why did I exit at the level I did, simply go to the M30 chart image So using level of supply and demand you can now see the orders being placed at the levels.
Predicting the sp500 on the hourly chart
- Hurst replied Oct 30, 2023
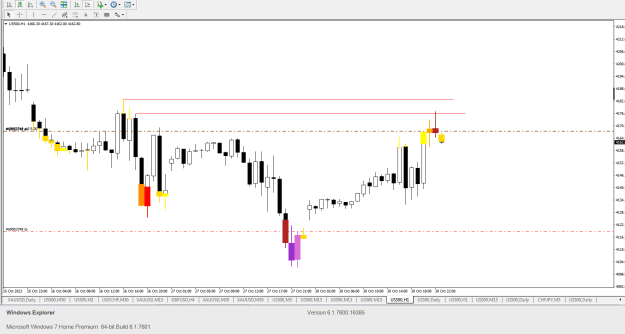
image Although, on the daily chart it maybe possible we have a low on the daily chart, i am still hoping for a gap fill. The hourly chart shows how effective the candles are in identifying the possible turn. simply using support and resistance ...
Predicting the sp500 on the hourly chart
- Hurst replied Oct 30, 2023
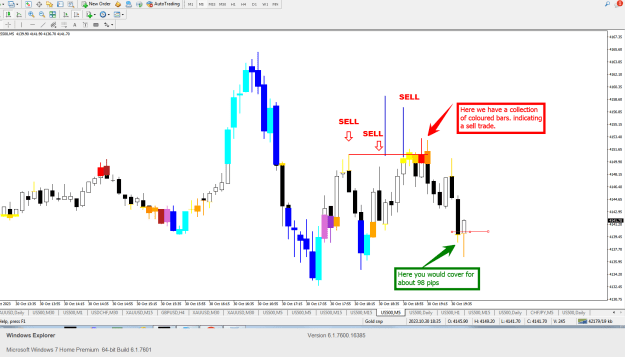
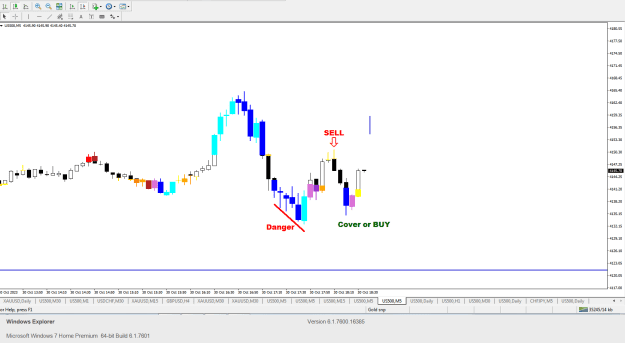
image So this trade was good for about broker I use, as soon as you get coloured candles showing you simply close the trade Of course you can get fancy and use really good price protection methods, in combination with the coloured bars you get ...
Predicting the sp500 on the hourly chart
- Hurst replied Oct 30, 2023
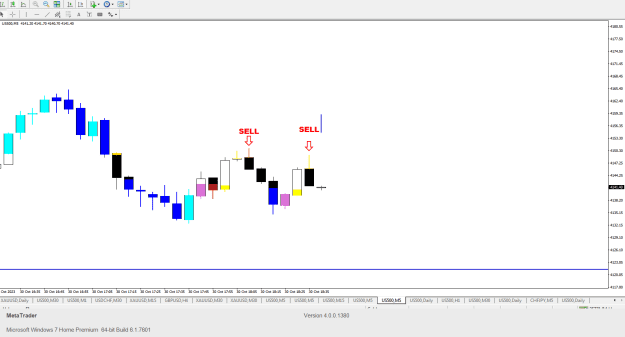
image so on the M5 chart we have a valid sell signal, so looking to go short.
Predicting the sp500 on the hourly chart
- Hurst replied Oct 30, 2023
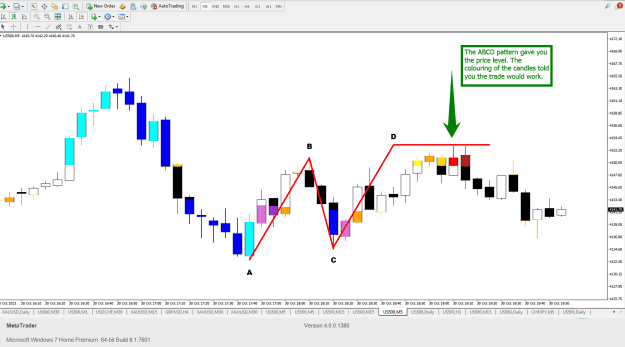
image Here on the M5 chart you can see the coloured bars forming at the lows. You can also see the pale yellow lines forming at the highs, so now I am simply waiting for a couple of coloured bars.
Predicting the sp500 on the hourly chart
- Hurst replied Oct 30, 2023
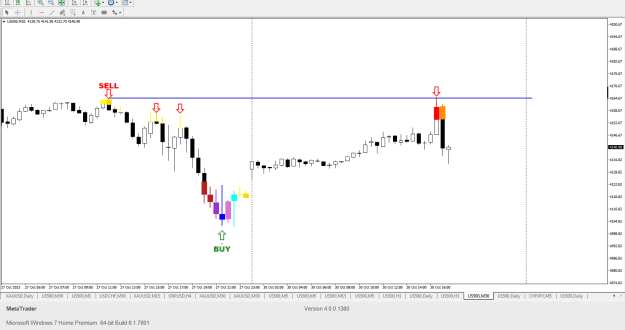
The indicator will work on any market and mostly the time frames over 30 mins produce exceptional results. image You can see right on resistance we got a coloured red candle formed at the top, a clear sell signal, so now we hold till the buy ...
Predicting the sp500 on the hourly chart
- Hurst replied Oct 30, 2023
A TOTALLY NEW CONCEPT IN TRADING After a long time I am back with a brand new concept, that none of you will have ever seen. What if you could see the foot prints of the banks and market makers in the charts? I am talking about actually seeing where ...
Predicting the sp500 on the hourly chart
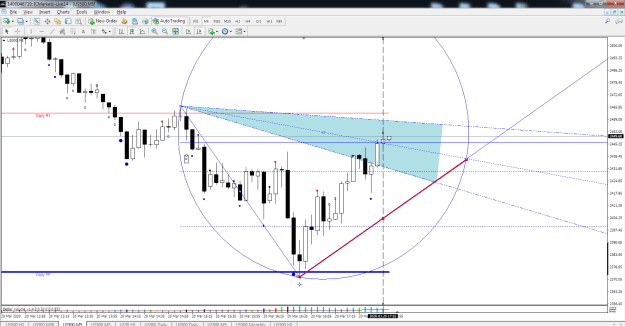
- Hurst replied Dec 2, 2022
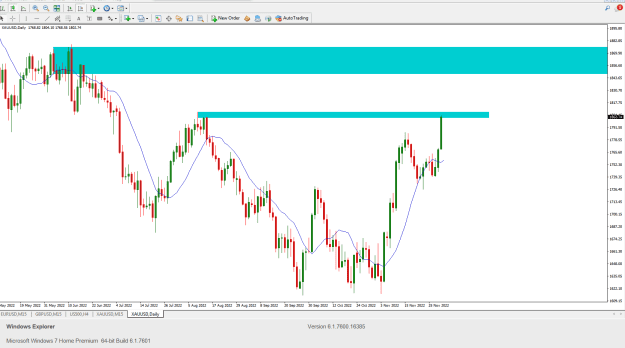
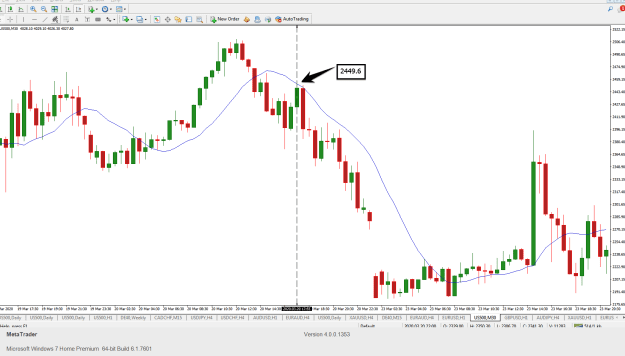
I sent this gold chart to one of our indicator owners last night. image Ideal price action to look for a retrace in gold to sell.
Predicting the sp500 on the hourly chart
- Hurst replied Nov 28, 2022
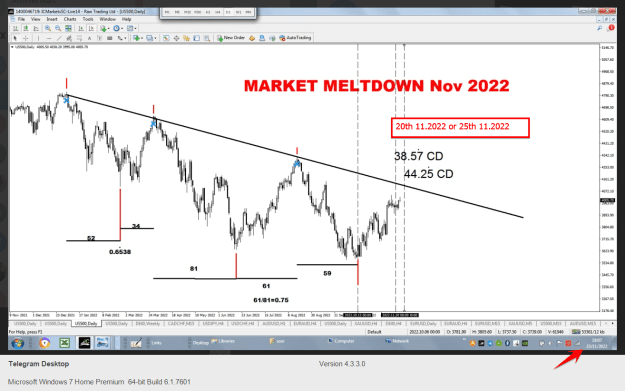
The SP500 is shaping up for a sell trade soon image I seem to be the only one on FF that makes market calls before they happen. I think I posted it here or on my Telegram channel image So if you are not on my Telegram channel you should be.
Predicting the sp500 on the hourly chart
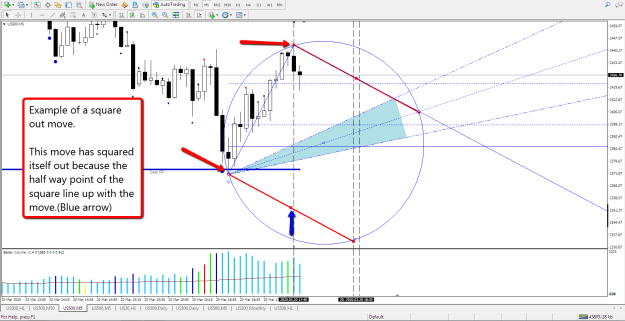
- Hurst replied Nov 28, 2022
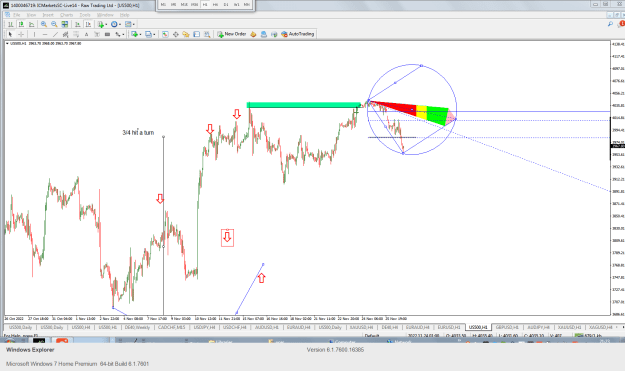
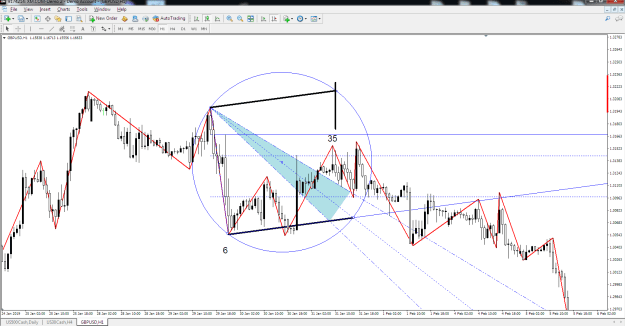
Hypermagic Line Indicator Reaction Points in Time image The mid points and end points of the square, and the edge of the circle often give turns in time.
Predicting the sp500 on the hourly chart
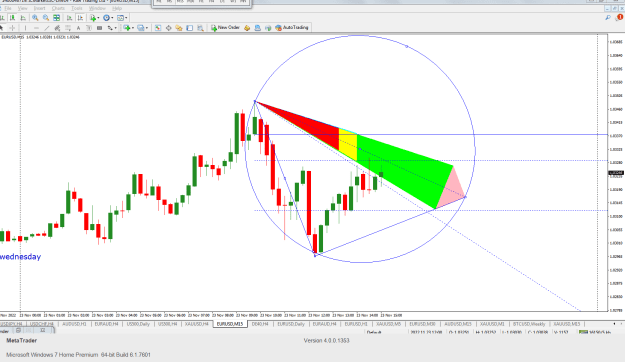
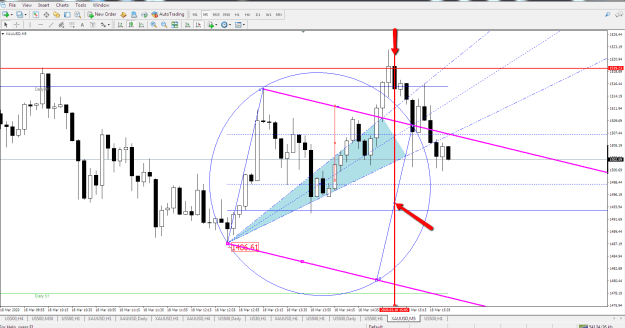
- Hurst replied Nov 25, 2022
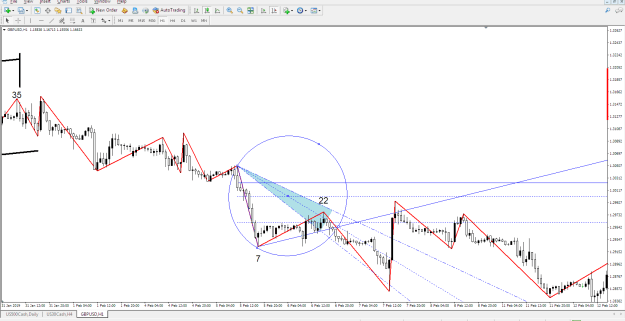
When I was developing the indicator I noticed so very interesting relationships in not only time but also price. I have listed these below: image see how the top square edge on the RHS marks the top of the retrace in time image The time to the ...
Predicting the sp500 on the hourly chart
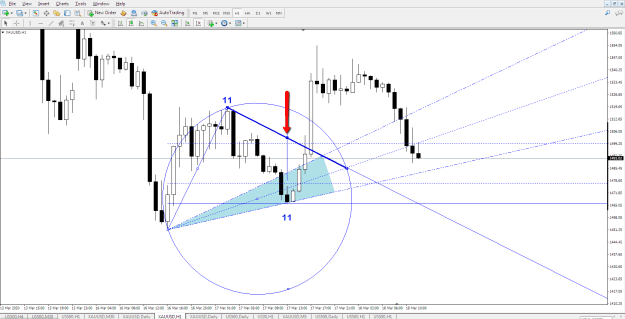
- Hurst replied Nov 23, 2022
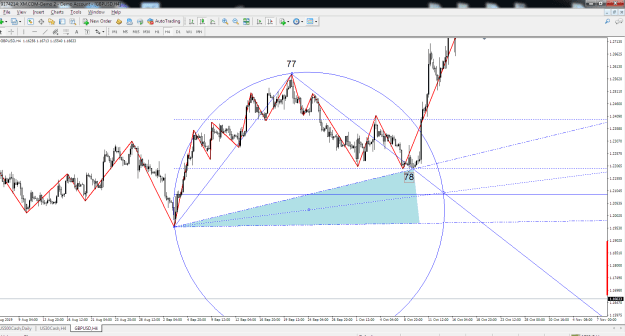
Do not worry about the yellow zone remember that as long as the price is at the yellow zone or past it you can take the trade. image
Predicting the sp500 on the hourly chart