- Search Forex Factory
- 758 Results
-
 Scrat replied May 8, 2013
no clear break to the upside. support @ 151.66 area, no significant buying activity and u-j / g-u are still bearish at the moment.
Geppy's Geppy Thread (GBP/JPY)
- Scrat replied May 6, 2013
you mean like this? yes, i agree
Geppy's Geppy Thread (GBP/JPY) . just that this is not really bearish in my view, only a pullback. 2-3 days at most.
- Scrat replied May 2, 2013
okay i looked again at my charts and have some additional comments. short term trend. it's all about 150.72, if this gives way then price will dive further. overall trend (that is, MEDIUM/LONG term) is still bullish but for NOW, i think we are in ...
Geppy's Geppy Thread (GBP/JPY)
- Scrat replied Apr 26, 2013
and here's the selling. i'm gonna stop thinking about buying for now and will look for clear selling signals, i'm guessing this wants to go to 150 or 149 - just run a fibo from 146.34 for relevant levels below
Geppy's Geppy Thread (GBP/JPY)
- Scrat replied Apr 25, 2013
if u-j would break out of this trap, we'll also see some movement on g-j. i've got pending longs above 99.76 and shorts below 98.96. arrows indicate background action, and if price goes above each significant setup then it's pretty much safe to ...
Geppy's Geppy Thread (GBP/JPY)
- Scrat replied Apr 25, 2013
buying volumes are going lower and lower as we go higher and higher, so looks like the rally is running on fumes.
Geppy's Geppy Thread (GBP/JPY)
- Scrat replied Apr 24, 2013
about longs on yen pairs - u-j seems to show important selling activity at the top. while it's true that price can pop above for some time, this chart is telling me that the sell-off of u-j is being set up real nice. i just need a confirmation to ...
Geppy's Geppy Thread (GBP/JPY)
- Scrat replied Apr 18, 2013
just came home after a long day. i love a cold kombucha
Geppy's Geppy Thread (GBP/JPY) oh and to stop spamming the thread - does this seem ok in terms of concept
  : - short if last blue segment is taken, or - long if pink segment is taken
- Scrat replied Apr 18, 2013
we are within the weekly value area (where most of the trades take place - ~70%), see red shade. no breakout to the upside yet. obviously, this looks like consolidation BUT let's take into consideration the low volume activity at the higher edge of ...
Geppy's Geppy Thread (GBP/JPY)
- Scrat replied Apr 17, 2013
this is my map for trading g-j medium term. we are in an upswing that can be seen on daily tf. inside this upswing, there is a leg down that can be seen on h4 - is this complete? i think not (although i may be wrong but we'll see) and so i am trying ...
Geppy's Geppy Thread (GBP/JPY)
- Scrat replied Apr 17, 2013
looks like we're heading to 147.81, first support put in place by yesterday's ny close.
Geppy's Geppy Thread (GBP/JPY)
- Scrat replied Apr 16, 2013
increasing volumes when moving up, first time since upper 153, it's starting to become interesting. support is at 148.10 for now.
Geppy's Geppy Thread (GBP/JPY)
- Scrat replied Apr 15, 2013
big picture for now - no significant buying activity, while selling volumes are still high. i'd say this looks like a range before another bear rally, if things stay like that.
Geppy's Geppy Thread (GBP/JPY)
- Scrat replied Apr 13, 2013
my ares for tp are 146.30, but i will not completely close my shorts there. the next one on my list is 144.60, and if it makes it there i will unload completely. i explained earlier how i came up with these values, it has to do with weekly/monthly ...
Geppy's Geppy Thread (GBP/JPY)
- Scrat replied Apr 12, 2013
okay, let's pause for a moment - has anyone looked at the weekly chart? today's close made it very interesting considering we have been in an uptrend for about one year. wouldn't it be time to get a real pullback, just like this one? 133-136 in a ...
Geppy's Geppy Thread (GBP/JPY)
- Scrat replied Apr 12, 2013
here is where i think it will go by the end of today, and then we'll take it from there. that's weekly pvp (peak volume price)
Geppy's Geppy Thread (GBP/JPY)
- Scrat replied Apr 11, 2013
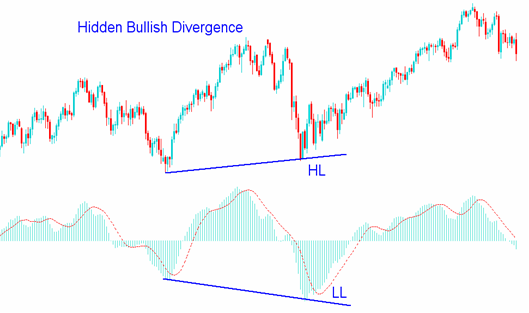
an example... it means that in an established uptrend, an oscillator makes a lower low during a pullback (or a higher high if the trend is down).
Geppy's Geppy Thread (GBP/JPY)
- Scrat replied Apr 9, 2013
yes, because price went just a bit below last relevant low of yesterday' swing (150.59). also, check out this chart - volumes decreased on buying, although price kept making new highs; but at the same time, they increased on selling + now we have ...
Geppy's Geppy Thread (GBP/JPY)
- Scrat replied Apr 6, 2013
alright people, now here's the weekly profile at the end of the week. we had a close (149.50) way above value area (gray colored). price will come back to test it sometime in the near future (1-2...4 weeks or so), so just keep in mind 146.27 ...
Geppy's Geppy Thread (GBP/JPY)
- Scrat replied Apr 4, 2013
someone here mentioned 115 for u-j, that's funny, because this is what i see on yearly profiles. here's the chart. there are two major "gaps" (see the big white arrows), one is mid-114 (it's been 5 years since then and it's really due!!!) and the ...
Geppy's Geppy Thread (GBP/JPY)