- Search Forex Factory
- 39 Results (1 Thread , 38 Replies )
- arhemsi replied Feb 16, 2014
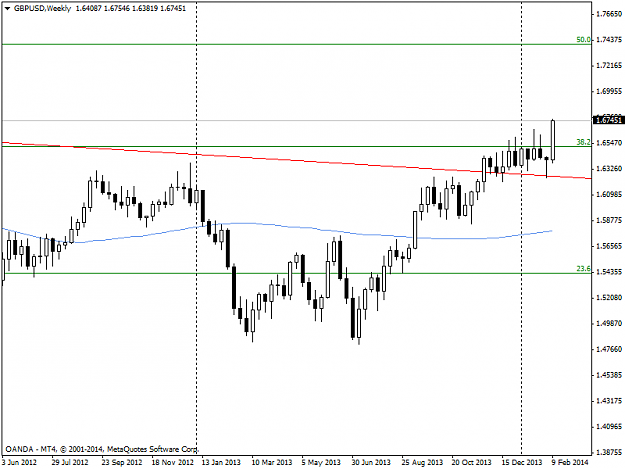
I totally agree jm, MM is the Holy grail. With MM, you can walk away from the trade knowing well that if the trade goes against you, you could only lose so much of the account. Now, I am attaching GU weekly chart. image I am thinking of BUY on ...
First withdrawal - what a feeling!!!
- arhemsi replied Aug 19, 2009
hey don..my mv friend
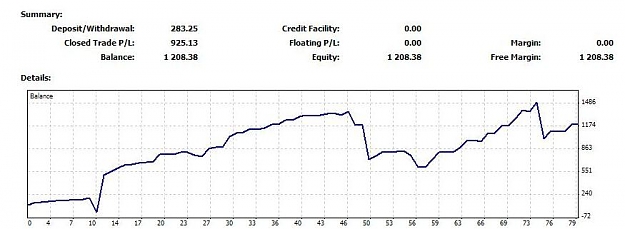
First withdrawal - what a feeling!!! very nice of you to drop by. thanks for the advice. well, i need another $100 to meet my weekly target. normally the last $100 is so tricky for me. i think i need all the luck i can get. wish me luck my friend. image

- First withdrawal - what a feeling!!!Started Aug 15, 2009|Trading Journals|9 replies
Last week, I made my first withdrawal ever of $500. What a feeling!!! Now I plan to withdraw $500 ...

- arhemsi replied Jan 25, 2009
This is interesting. If we look at the last 3 days candle on GU, it is all a doji/hammer like candles that were preceded by a similar candle patterns. Take a look at the chart at the check mark areas image
Inside the candle

- arhemsi replied Jan 3, 2009
image Last year GU ranged for seven months, starting in January and ending in July '08. Will history repeat itself?. Its going to be interesting to see this year unfolds.
james16 Chart Thread

- arhemsi replied Dec 14, 2008
image I have an EMA crossover signal and it seems that all indicators lined up except for the laquerre which is above 75, therefore, it is no trade. Right Guys
Trend Follower 5 Minute System ?
?

- arhemsi replied Oct 25, 2008
Hello Guys, I see a possible sell is forming in GU H1. image
Powerful Fib Based System - by DAZfx
- arhemsi replied Oct 24, 2008
Hello Kang, nice to see you in this thread and thanks for sharing all the cool indicators. Here is my EU chart employing the indicators that you posted. Great chart!! image
Cornflower Hourly System

- arhemsi replied Oct 12, 2008
I hope to the south, and till the lower trendline in red image
Cable Update (GBPUSD)
- arhemsi replied Sep 14, 2008
Yes it is the dilemma. Buy on dip/pullback?? image Time to short?? image
New Mouteki Method...
- arhemsi replied Sep 14, 2008
Inspired by Mouteki — image Here is GBPCHF weekly chart. I drew the fib zones off the yearly open which is at 2.2437. I know this is not according to Mouteki, so I am sorry if this offensive to the spirit of this thread. Based on this GBPCHF ...
New Mouteki Method...
- arhemsi replied Sep 10, 2008
I predict this retracement of GU should at least go to 1.7735 image I got Mouteki, huh?
New Mouteki Method...
- arhemsi replied Sep 8, 2008
image I took this signal for 20 pips.( on demo) *Bad signal>>>>>stoploss 20 pips hitted..
Cornflower Hourly System
- arhemsi replied Sep 8, 2008
[quote=bob_inabottle;2206259] Yes Bob, thats what I am referring to. The idea was to take the 8/24 crosses after a bounce off the potential reversal zone (i.e, 8/12 area, 12/24 area, etc...) and in the direction of the trend as signified by the ...
Cornflower Hourly System

- arhemsi replied Sep 5, 2008
An Entry's Idea
Cornflower Hourly System — Lever70 has said somewhere in the thread of looking at the crosses of the 8 and 24emas in the 15 minutes time frame as an entry signal. So, I plotted the following emas : 288,192,96,48 and 32 which represents the ...
- arhemsi replied Aug 31, 2008
Hi dz, Am I plotting this correctly? image Thanks.
7am-9am Big Dog USD Breakout Strategy
- arhemsi replied Aug 24, 2008
image Looking for cf trade in GBPCAD next week
Cornflower Hourly System

