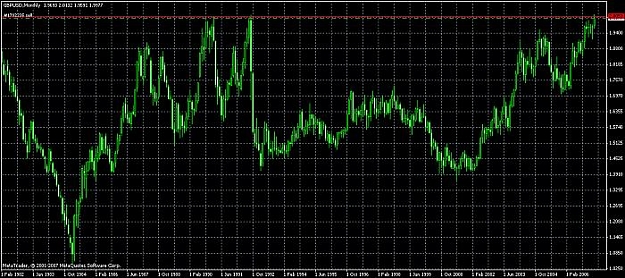
Check out this monthly chart of the cable.
As you all know it has hit the 2.00 ceiling again after 15 years. (Hit before in 1991 and 1992)
Is there any long term economic data that suggests this uprwads trend will continue and break the 15 year $2 barrier?
How does this strategy sound to you?
-> Short current levels, with a 200 pip stop loss (risking very little)
Now lets say it fails to hold and falls to 1.98, you add more to your short position. And continue to do so as it falls.
Any thoughts?
Attached Image (click to enlarge)