Portfolio Compilation Step 1 - The Raw Portfolio
Let us say that you have a number of different strategies and/or systems, each with varying volatile equity curves. The temptation is to select the overall best performer and go with that one, but this method outlines a process where you use all of them and then risk treat them to compile a portfolio that achieves a far great result than the sum of it's parts.
My other thread looks at a semi-automatic momentum breakout system on M30 which has been tested across numerous markets (24) over the last 10 years. I will use the results from this system as a basis for explaining how to compile robust portfolios. About 19 of the 24 tested systems have what I regard as a slight edge. Over the 10 year horizon they simply managed to be profitable. While there is no guarantee of an edge....there is a good chance that an edge is present in these 19 systems given the trade sample size for each and more importantly the range of different market conditions that have been experienced by each.
I use all of these slightly profitable systems for my portfolio compilation and avoid the temptation to cherry pick the best performers. This does not mean that the remaining poor performing 5 markets are not continuously tracked and backtested. They are. If they become more profitable over the longer term into the future then they will also be included in the portfolio at a later date. We just do not include them now based on their track record.
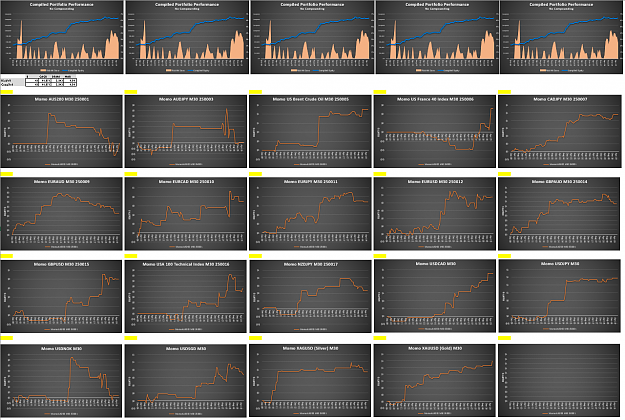
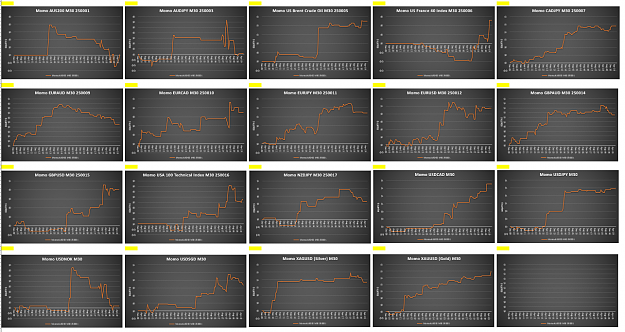
So below is a chart of the individual equity curves over the 10 year period of each slightly profitable system.
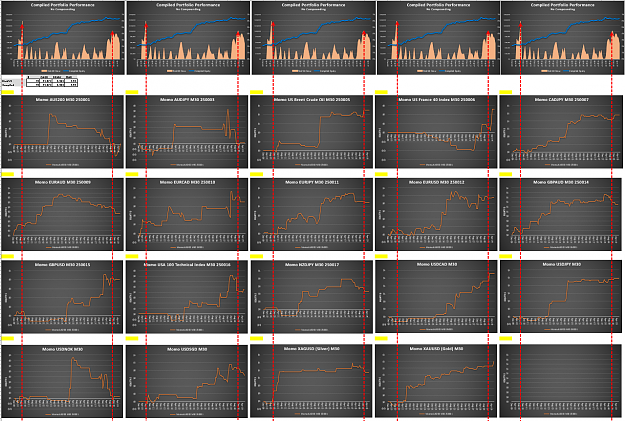
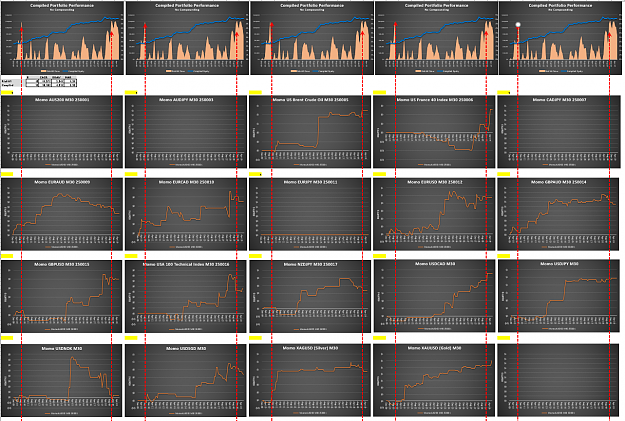
....and this is how they look when superimposed on the same chart for a spaghetti experience.
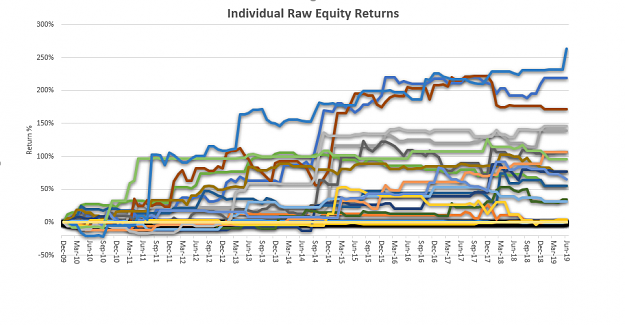
Bloody awful aren't they? Some are ok....but many are all over the shop in terms of overall volatility.
Here is a table of performance metrics of each strategy.
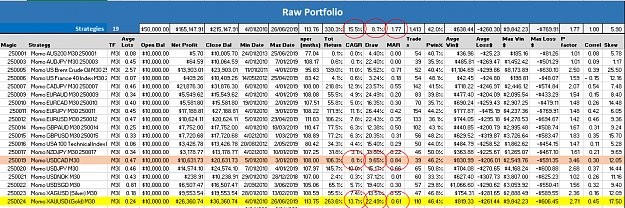
The temptation would be to select XAUUSD from the list given it's overall result (refer to yellow highlight). This produced the best overall return (a CAGR of 13.7%).....however if you look at the MAR ratio column, in risk weighted terms you may have found a better choice using MAR. With different max drawdowns such as USDCAD (highlighted in pink), the difference in apparent profitability is simply a factor of volatility leverage.
For example Gold has a max draw of 22.49% and a CAGR of 13.7%. USDCAD has a max draw of 9.65% and a CAGR of 8.1%. I could double the position size of USDCAD to achieve the same max draw of Gold at 13.7% and in doing so, my CAGR would be approximately the same %.
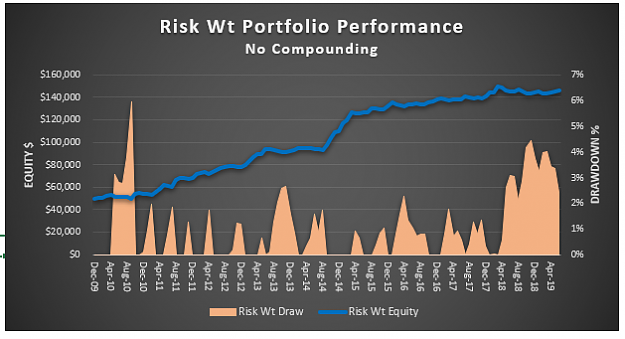
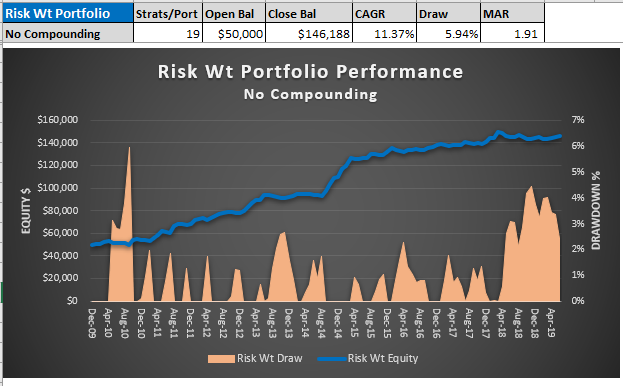
Now look at the result of simply adding these individual systems together assuming a total $50K portfolio.
Firstly note how simple addition has reduced the overall drawdown to 8.74% for the entire collection. This is attributed to the fact that drawdowns of each different system occur in diferent places.
Now also note the MAR ratio of 1.77 which is far higher than what can be achieved at an individual strategy level. This MAR ratio means that pound for pound, the portfolio is about two times more powerful with an equal allocation of capital than your best single system performer (XAUUSD). Now remember we have not applied selection bias here. We have used all those shitty return streams with a slight positive edge....and not simply the best one.
What we are doing here with diversification is optimising our risk results. We are not optimising our profit results. Risk and return are inherent in any asset. We can manage future risk but without a crystal ball we can do nothing about future profits.
Diversification's free lunch resides in the following principle: The impact of addition suppresses the individual drawdowns of each return stream and the positive edge in each system is magnified by amplification. Even from simple raw addition, without any further portfolio treatment, your risk adjusted returns are significantly improved. This allows you to scale up global position sizing across all systems to reach for the stars in terms of CAGR while still managing your drawdown.
That is all good in theory with a backtest, but how do you manage this in practice in the live environment? Well you commence with the backtested 19 slightly profitable systems and continue to monitor their profit factor. As soon as the backtest plus walk forward result dips into negative profit factor territory, you turn them off. You still continue to monitor them...and when they slip back into an overall positive profit factor....you turn them back on. Over time markets will slip into and out of your live portfolio based on this principle. You are not looking at highly profitable systems here. You are just including those systems in your portfolio with a slight positive edge....no matter how weak. Later we will be utilising these curves to do some wicked things at the portfolio level.
Next post will look at Step 2 Portfolio treatment which standardises the volatility of each return stream in the portolio.
Cheers
C
Let us say that you have a number of different strategies and/or systems, each with varying volatile equity curves. The temptation is to select the overall best performer and go with that one, but this method outlines a process where you use all of them and then risk treat them to compile a portfolio that achieves a far great result than the sum of it's parts.
My other thread looks at a semi-automatic momentum breakout system on M30 which has been tested across numerous markets (24) over the last 10 years. I will use the results from this system as a basis for explaining how to compile robust portfolios. About 19 of the 24 tested systems have what I regard as a slight edge. Over the 10 year horizon they simply managed to be profitable. While there is no guarantee of an edge....there is a good chance that an edge is present in these 19 systems given the trade sample size for each and more importantly the range of different market conditions that have been experienced by each.
I use all of these slightly profitable systems for my portfolio compilation and avoid the temptation to cherry pick the best performers. This does not mean that the remaining poor performing 5 markets are not continuously tracked and backtested. They are. If they become more profitable over the longer term into the future then they will also be included in the portfolio at a later date. We just do not include them now based on their track record.
So below is a chart of the individual equity curves over the 10 year period of each slightly profitable system.
Attached Image (click to enlarge)
....and this is how they look when superimposed on the same chart for a spaghetti experience.
Attached Image (click to enlarge)
Bloody awful aren't they? Some are ok....but many are all over the shop in terms of overall volatility.
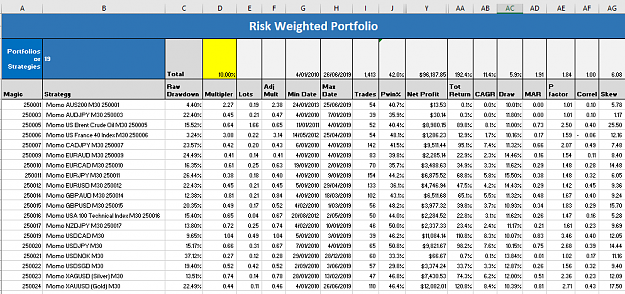
Here is a table of performance metrics of each strategy.
Attached Image (click to enlarge)
The temptation would be to select XAUUSD from the list given it's overall result (refer to yellow highlight). This produced the best overall return (a CAGR of 13.7%).....however if you look at the MAR ratio column, in risk weighted terms you may have found a better choice using MAR. With different max drawdowns such as USDCAD (highlighted in pink), the difference in apparent profitability is simply a factor of volatility leverage.
For example Gold has a max draw of 22.49% and a CAGR of 13.7%. USDCAD has a max draw of 9.65% and a CAGR of 8.1%. I could double the position size of USDCAD to achieve the same max draw of Gold at 13.7% and in doing so, my CAGR would be approximately the same %.
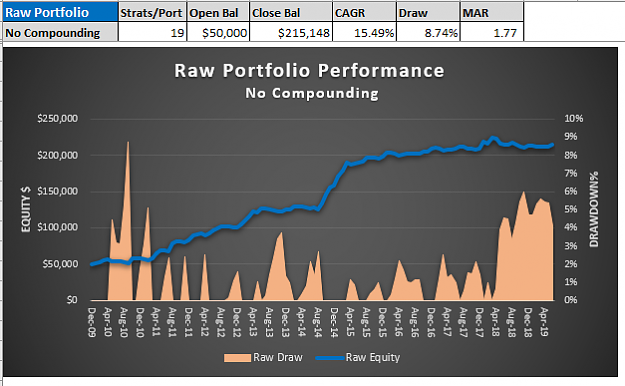
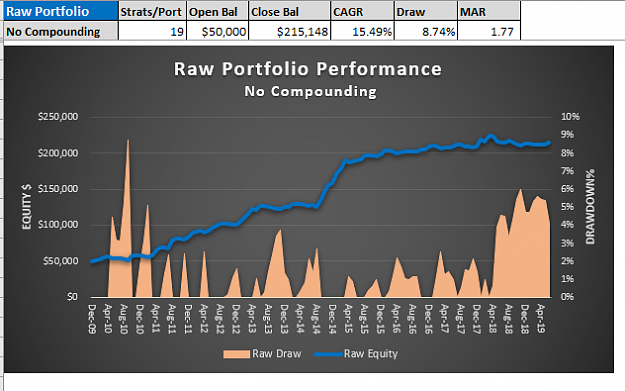
Now look at the result of simply adding these individual systems together assuming a total $50K portfolio.
Attached Image (click to enlarge)
Firstly note how simple addition has reduced the overall drawdown to 8.74% for the entire collection. This is attributed to the fact that drawdowns of each different system occur in diferent places.
Now also note the MAR ratio of 1.77 which is far higher than what can be achieved at an individual strategy level. This MAR ratio means that pound for pound, the portfolio is about two times more powerful with an equal allocation of capital than your best single system performer (XAUUSD). Now remember we have not applied selection bias here. We have used all those shitty return streams with a slight positive edge....and not simply the best one.
What we are doing here with diversification is optimising our risk results. We are not optimising our profit results. Risk and return are inherent in any asset. We can manage future risk but without a crystal ball we can do nothing about future profits.
Diversification's free lunch resides in the following principle: The impact of addition suppresses the individual drawdowns of each return stream and the positive edge in each system is magnified by amplification. Even from simple raw addition, without any further portfolio treatment, your risk adjusted returns are significantly improved. This allows you to scale up global position sizing across all systems to reach for the stars in terms of CAGR while still managing your drawdown.
That is all good in theory with a backtest, but how do you manage this in practice in the live environment? Well you commence with the backtested 19 slightly profitable systems and continue to monitor their profit factor. As soon as the backtest plus walk forward result dips into negative profit factor territory, you turn them off. You still continue to monitor them...and when they slip back into an overall positive profit factor....you turn them back on. Over time markets will slip into and out of your live portfolio based on this principle. You are not looking at highly profitable systems here. You are just including those systems in your portfolio with a slight positive edge....no matter how weak. Later we will be utilising these curves to do some wicked things at the portfolio level.
Next post will look at Step 2 Portfolio treatment which standardises the volatility of each return stream in the portolio.
Cheers
C
3