THIS IS IT. WHAT DOES IT. HARD TO TAKE IT.
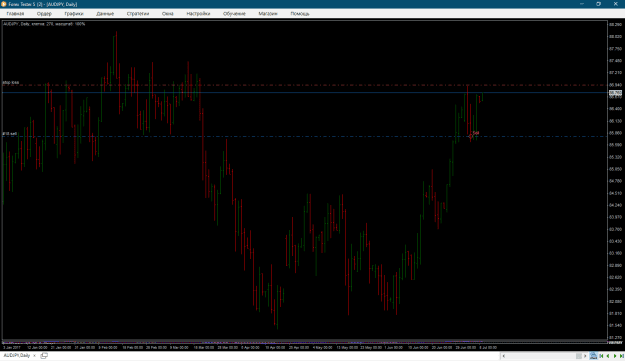
Look at this trade, it is going to become unprofitable and I will take a full stop loss.
I attach a screenshot with more data. I think this is enough.
I start with the moments that convinced me to open this trade:
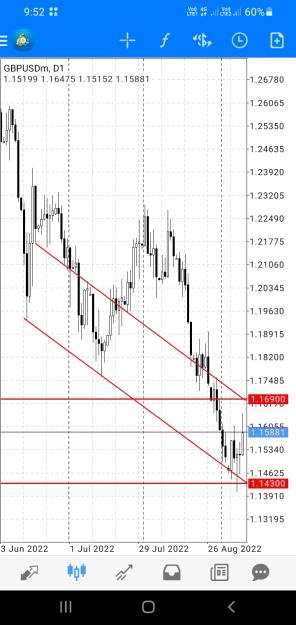
1. Price at previous highs.
2. Entry below round level 1.86.
3. To the next level 1.85, a decent distance.
4. Level 1.85 confluence with the previous high, I also mark it as the first problematic level for the price.
5. The 1.85 level equals with the 38% retracement.
6. A lot of space on the left.
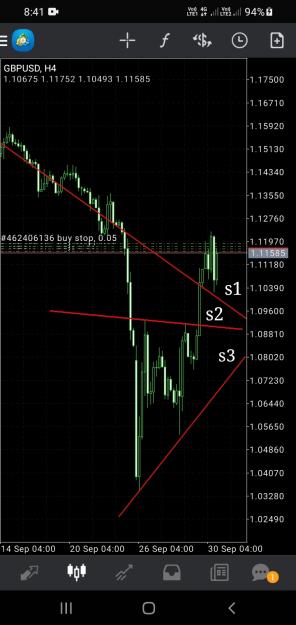
Maybe there is something else, but that's enough for me.
In general, the price does what it does. Although 10 confluences, such reversals happen frequently.
Okay, let me show you what is behind this reverse. This reversal is no accident at all, and many of the readers immediately saw why the price reversed here, I'm sure.
Obvious I saw this bright high on the left, I saw this min/max cluster on the right side of the chart. I also saw this huge consolidation on the left side of the chart and its lows. But these lows are so far from the current price, this is an empty space on the left, there is so much of it, this is a cluster of min / max on the right side of the chart, it is not significant, there is not even a round level, it is on our side. And despite all this, the price has no chance, point for point, despite the full potential of the Outside Bar, the size of this bar which is also a plus to the points for entering a trade, stops at this support.
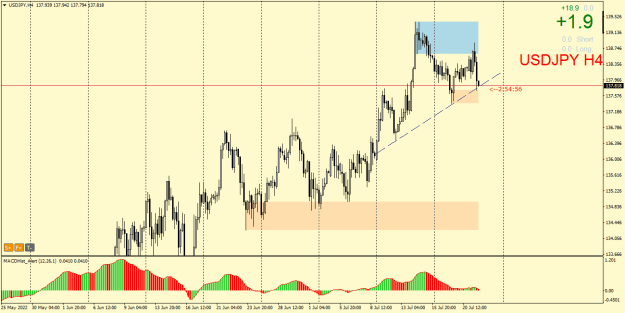
This trade is a clear example of what is hard for me to accept as a trader.
Look at this trade, it is going to become unprofitable and I will take a full stop loss.
Attached Image (click to enlarge)
I attach a screenshot with more data. I think this is enough.
Attached Image (click to enlarge)
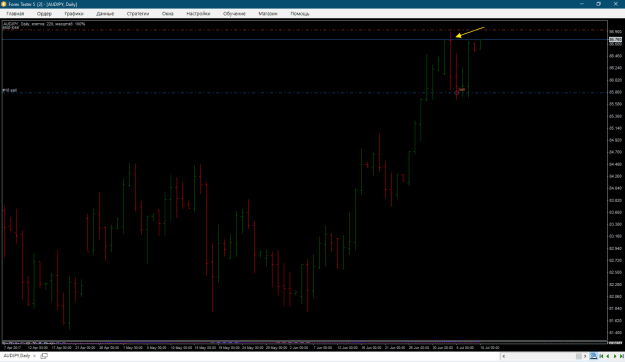
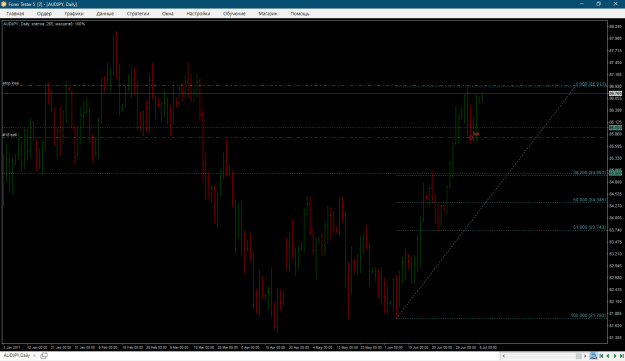
I start with the moments that convinced me to open this trade:
1. Price at previous highs.
2. Entry below round level 1.86.
3. To the next level 1.85, a decent distance.
4. Level 1.85 confluence with the previous high, I also mark it as the first problematic level for the price.
5. The 1.85 level equals with the 38% retracement.
6. A lot of space on the left.
Maybe there is something else, but that's enough for me.
In general, the price does what it does. Although 10 confluences, such reversals happen frequently.
Attached Image (click to enlarge)
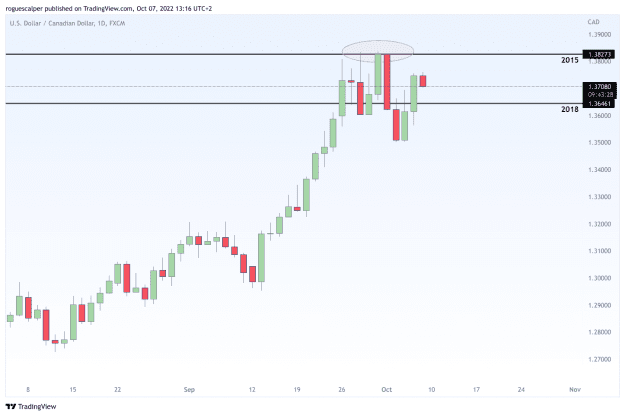
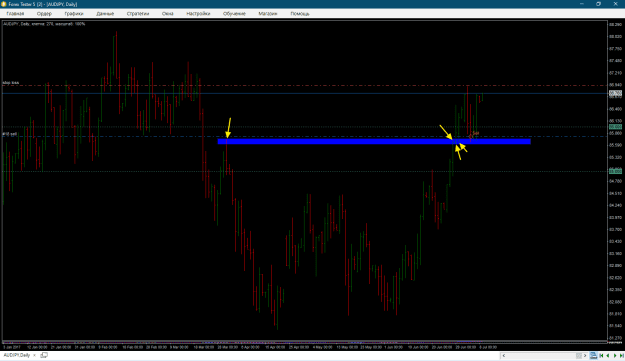
Okay, let me show you what is behind this reverse. This reversal is no accident at all, and many of the readers immediately saw why the price reversed here, I'm sure.
Attached Image (click to enlarge)
Obvious I saw this bright high on the left, I saw this min/max cluster on the right side of the chart. I also saw this huge consolidation on the left side of the chart and its lows. But these lows are so far from the current price, this is an empty space on the left, there is so much of it, this is a cluster of min / max on the right side of the chart, it is not significant, there is not even a round level, it is on our side. And despite all this, the price has no chance, point for point, despite the full potential of the Outside Bar, the size of this bar which is also a plus to the points for entering a trade, stops at this support.
This trade is a clear example of what is hard for me to accept as a trader.