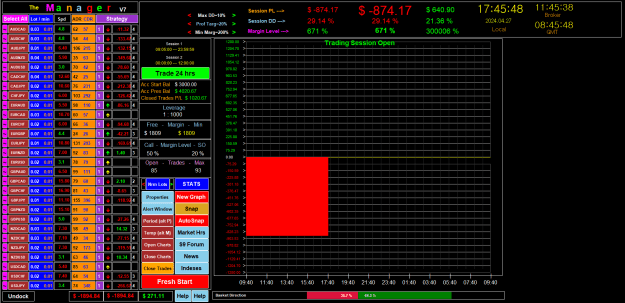
The Manager_v7
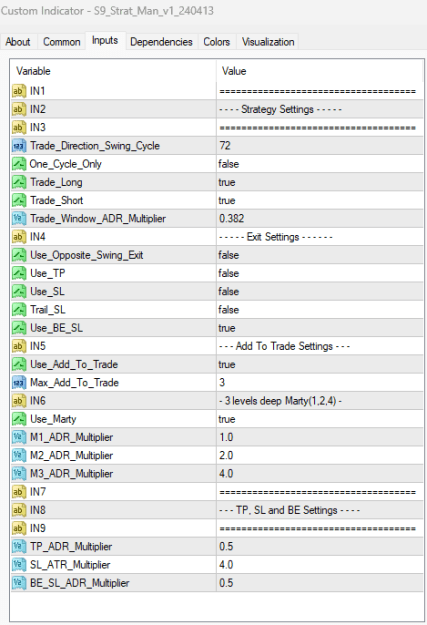
Strat_Man_v2
SWX-Marty-TSL Default Settings
Day 3 Apr 24 2024
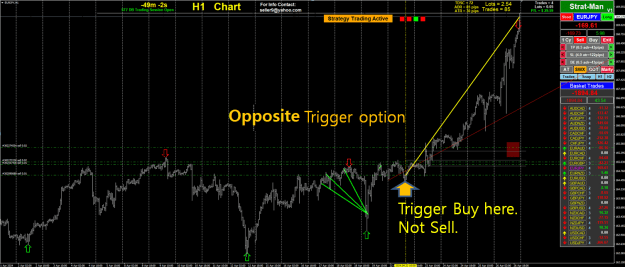
Note: Yellow Arrow Not displaying
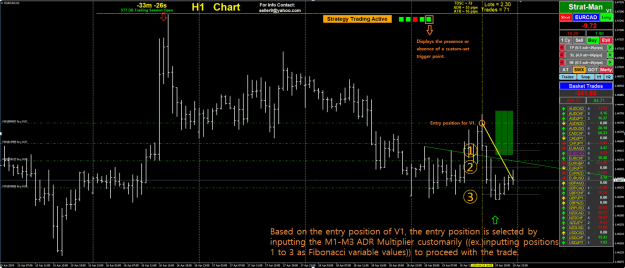
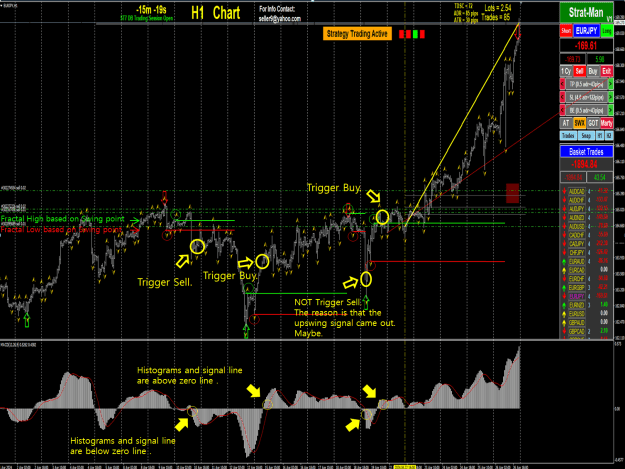
Strat_Man_v2
SWX-Marty-TSL Default Settings
Day 3 Apr 24 2024
Note: Yellow Arrow Not displaying
Attached Image(s) (click to enlarge)
1