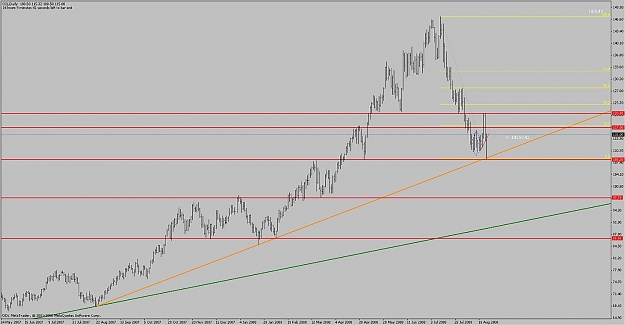
The second chart was the long-term downtrend for the dollar. The SEC manufactured rally that started on July 15 only brought the dollar up to its trend line. It didn’t break above the trend, just jumped up to it.
http://www.investorsdailyedge.com/Is...ge001_0000.gif
The chart of the dollar is a secondary reason for me to be short-term bullish on oil.
Let’s face it, a big part of the jump in oil over the last few years can be directly attributed to the fall in the dollar. It stands to reason that oil won’t break major support without a breakout of the dollar. And I don’t look for this to happen until the Fed can raise interest rates. Given the current economic environment, it doesn’t look like the Fed will be raising interest rates anytime soon.
As for the long-term bearish view on oil, consumers are fed up with high gas and oil prices and we are seeing a shift in demand. This is similar to what happened in the early 1980s when we saw oil fall dramatically as demand fell for five straight years. The higher the price, the lower the demand. Since the supply and demand curves for oil are somewhat inelastic over the short term, price jumps and drops have little impact on usage. But when prices stay high for extended periods, the entire demand curve shifts to the left.
http://quotes.ino.com/chart/?s=NYBOT...i&w=15&t=l&a=2
{Promotion Removed}