All this talk of larger time frames I have looked at my Monthly Chart which I do not tend to study in any great detail.
Once again the fibs have left me amazed.
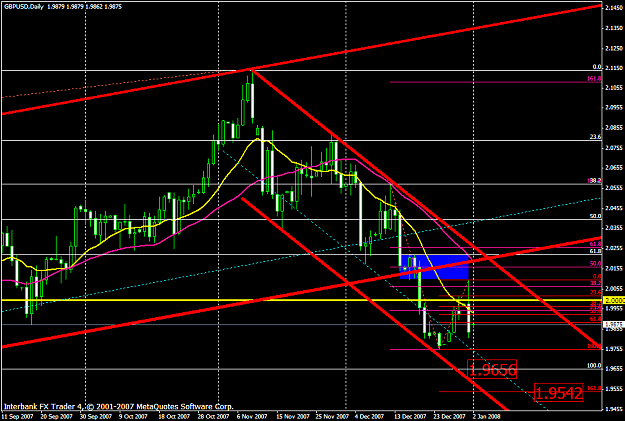
I plotted my major red channel. I had to put the lower line from the very bottom candle without being broken. I realise this is not a confirmed trend line like the broken black old channel but it makes interesting viewing when you look at the fibs.
I plotted 2 fibs red one on the last big move down and the blue one on the recent move up.
When you look at the red upper resistance line and the fib projection 161.8 @2.1102 you see that they align perfectly with the Nov candle. I believe the professionals were targeting 2.1102 and not 2.1160. I saw that move up on the day and I really could not see why it made it or why it stopped and fell so heavily.
We are now near the lower non confirmed red trend line and the 38.2% [email protected] off the recent monthly high and they are aligning perfectly with the Jan 08 monthly bar.
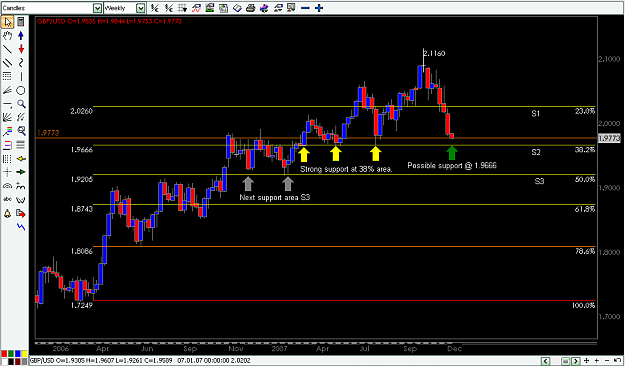
As pointed out by someone else here 1.9666 is also a major resistance being touched so many times as support and resistance.
On that basis I would be very cautious on taking a short below 1.9666 without a convincing break and if it dose not break this level I would guess GBP-USD will go up to 23.6 fib at 2.0237.
Once again the fibs have left me amazed.
I plotted my major red channel. I had to put the lower line from the very bottom candle without being broken. I realise this is not a confirmed trend line like the broken black old channel but it makes interesting viewing when you look at the fibs.
I plotted 2 fibs red one on the last big move down and the blue one on the recent move up.
When you look at the red upper resistance line and the fib projection 161.8 @2.1102 you see that they align perfectly with the Nov candle. I believe the professionals were targeting 2.1102 and not 2.1160. I saw that move up on the day and I really could not see why it made it or why it stopped and fell so heavily.
We are now near the lower non confirmed red trend line and the 38.2% [email protected] off the recent monthly high and they are aligning perfectly with the Jan 08 monthly bar.
As pointed out by someone else here 1.9666 is also a major resistance being touched so many times as support and resistance.
On that basis I would be very cautious on taking a short below 1.9666 without a convincing break and if it dose not break this level I would guess GBP-USD will go up to 23.6 fib at 2.0237.
Attached Image (click to enlarge)
#doyourownanalysisordietryin