This is my journal for trading the GBPJPY pair. I have been using a trading strategy that I developed and called "the triangle".
Trades last between 12hours and 6 days.
The system requires that you are in the market at all times.
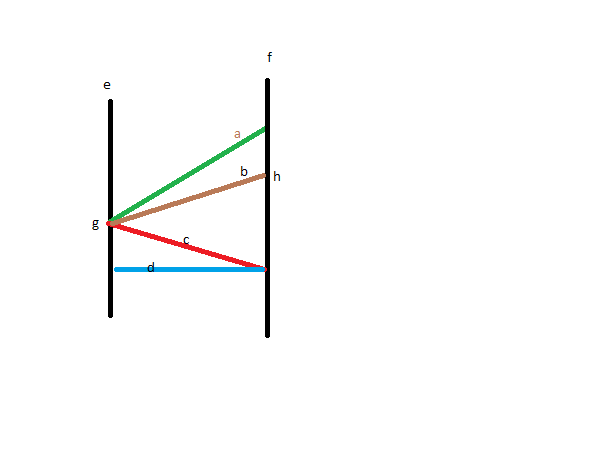
In the diagram below, we will draw a vertical line upon entry. In the diagram, I have used a long set-up example.
Line 'e' is drawn on the entry candle.
Upon exit of the trade, we will draw another line on the exit candle, line 'f'.
Line 'a' represents the highest level that that trade reached in profits while point line 'c' represents the lowest price went during the duration of that trade.
We will draw a resistance line at the highest point the trade reached and that should serve as our SL level for our next trade.
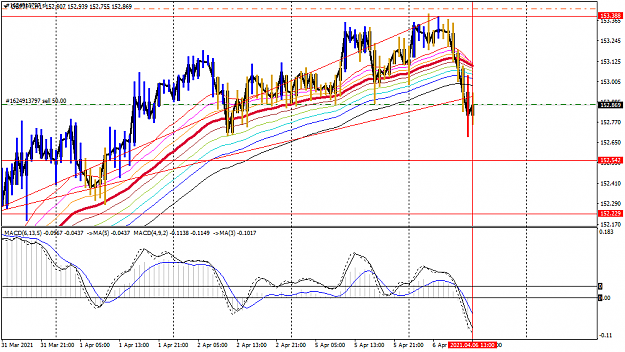
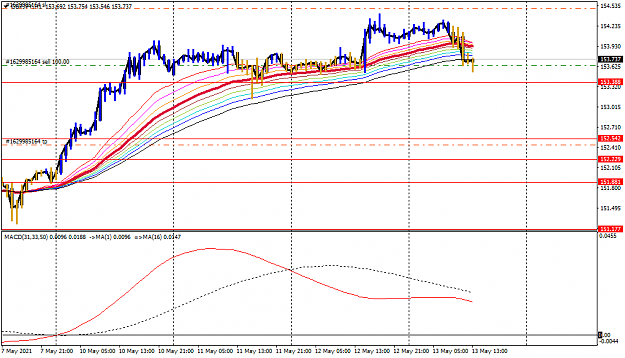
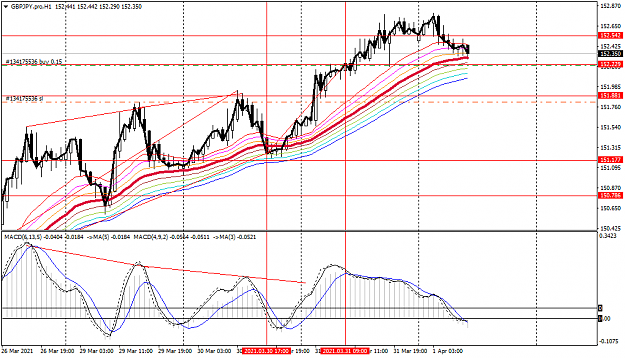
I use the 20-55 EMA and MACD indicators.
My current trade is also attached for reference.
Trades last between 12hours and 6 days.
The system requires that you are in the market at all times.
In the diagram below, we will draw a vertical line upon entry. In the diagram, I have used a long set-up example.
Line 'e' is drawn on the entry candle.
Upon exit of the trade, we will draw another line on the exit candle, line 'f'.
Line 'a' represents the highest level that that trade reached in profits while point line 'c' represents the lowest price went during the duration of that trade.
We will draw a resistance line at the highest point the trade reached and that should serve as our SL level for our next trade.
I use the 20-55 EMA and MACD indicators.
My current trade is also attached for reference.
Attached Image (click to enlarge)
Attached Image
I'm high on trading, cant you tell?