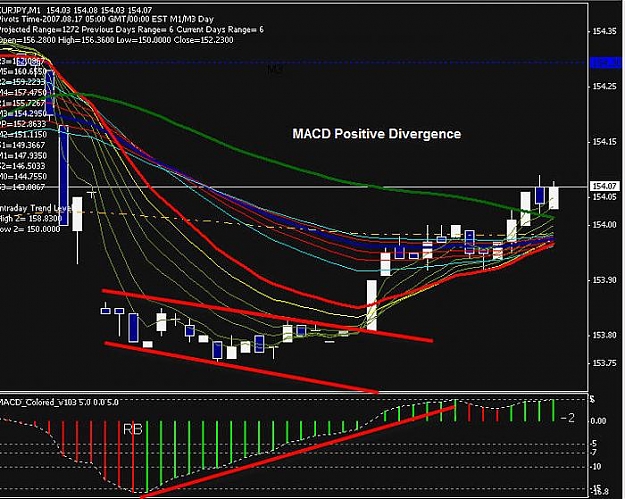
in conjuction with the guppy - just for a quick visual indication of some common chart patterns and momentum. if i see ZB, (zero bounce) then i look for mkt to bounce then resume the predominant 1 min trend. if i see RB (rounded bottom) with bar closes beneath the MAs, then i look for possible bouncing. if i see RT (rounded top) with bar closes above the MAs, then i look for possible retracement down.
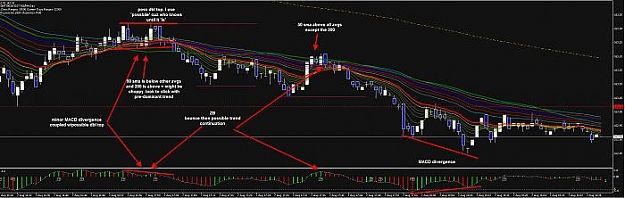
the thick green line is a 50 sma that i added.
when the 50 sma is under the other avgs and the 200 is above (and vice versa); watch out for some choppiness.
i also look for MACD divergences
i marked this chart up a bit...
PS: snagit is great. lol
techsmith.com
the thick green line is a 50 sma that i added.
when the 50 sma is under the other avgs and the 200 is above (and vice versa); watch out for some choppiness.
i also look for MACD divergences
i marked this chart up a bit...
PS: snagit is great. lol
techsmith.com
Attached Image (click to enlarge)