Edit: This thread has evolved so please read through to the end to be most up-to-date!
I've been on this forum for a while, mainly lurking and just checking what's new. Time has come for me to contribute on what I've accumulated thus far from this forum and from outside of this forum. Some of these teachings I've learned from others and have paid for using real $, so hopefully you will all benefit from this knowledge.
Supply & Demand as you likely already know is a concept involving the movement of price from point A to B due to a severe imbalance of … you guessed it... either supply or demand. That's it. This imbalance movement, although just a few pixels on your chart, is probably the net account of billions of currency units causing that price movement, so it's no small matter of coin we're talking about. There will be parties interested to get in on that action if price were to ever return these areas of interest.
Rules:
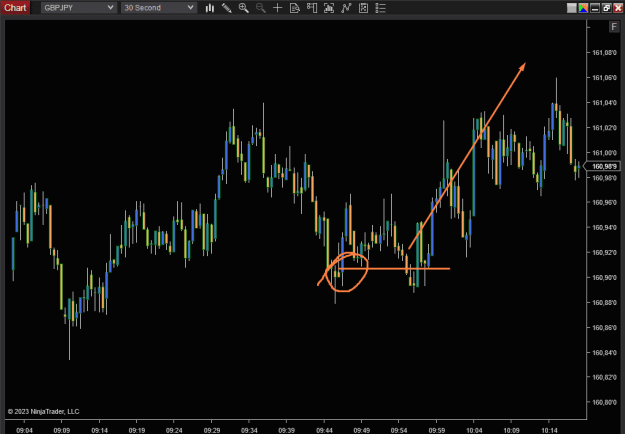
1. We look for areas where price actually moves away from a consolidated region. This is usually via a large candle overtaking previous candles, but doesn't have to be. It can also be a series of mid size candles. It just can't be many small candles.
2. We do not care for zones that are rapidly returned to within a matter of few candles. We want price to somewhat gradually come into it, and drop into it like long nosed bird which I can't remember the name of right now.
3. We enter as soon as price comes into our zone. Zones are made up of 2 lines:
Line 1: If bullish, the open of the nearest bearish candle. If bearish, the open of the nearest bullish candle. This candle can't be a doji looking. It has to be 'meaty'.
Line 2: If bullish, the lowest of the consolidated region prior to imbalance. If bearish, the highest of the consolidated region.
4. TP: Aim for most recent high/low.
5. SL: Place at Line 2.
Tips:
Find setups where price had the smallest amount of consolidation prior to taking off. We don't want too many candles in a consolidation prior to taking off.
There you have it. Before I share chart markups, I want YOU to post a chart markup so I can actually see if people understand what I wrote. Hit me up with any questions.
Note: There will be another concept called psychological price levels that will be used in conjunction with S&D setups. However, I will not introduce it immediately until there is traction in the thread and people are familiar with S&D first.
EDIT: Go to https://www.forexfactory.com/thread/...1#post14288421 for psych level introduction.
If you haven’t already done so join the Discord server for exclusive setups I share daily with the members:
https://discord.gg/TquBMt8KY5
Also, the Telegram channel is here for major announcements:
https://t.me/+0LnCla4fPAozZjRh
I hold bootcamps to go over all the trading techniques I use which is far too difficult to put in writing. I usually perform a bootcamp once per month if there is enough interest so please be sure to DM me or email me at [email protected] if you are interested and I can put your name on the list.
I've been on this forum for a while, mainly lurking and just checking what's new. Time has come for me to contribute on what I've accumulated thus far from this forum and from outside of this forum. Some of these teachings I've learned from others and have paid for using real $, so hopefully you will all benefit from this knowledge.
Supply & Demand as you likely already know is a concept involving the movement of price from point A to B due to a severe imbalance of … you guessed it... either supply or demand. That's it. This imbalance movement, although just a few pixels on your chart, is probably the net account of billions of currency units causing that price movement, so it's no small matter of coin we're talking about. There will be parties interested to get in on that action if price were to ever return these areas of interest.
Rules:
1. We look for areas where price actually moves away from a consolidated region. This is usually via a large candle overtaking previous candles, but doesn't have to be. It can also be a series of mid size candles. It just can't be many small candles.
2. We do not care for zones that are rapidly returned to within a matter of few candles. We want price to somewhat gradually come into it, and drop into it like long nosed bird which I can't remember the name of right now.
3. We enter as soon as price comes into our zone. Zones are made up of 2 lines:
Line 1: If bullish, the open of the nearest bearish candle. If bearish, the open of the nearest bullish candle. This candle can't be a doji looking. It has to be 'meaty'.
Line 2: If bullish, the lowest of the consolidated region prior to imbalance. If bearish, the highest of the consolidated region.
4. TP: Aim for most recent high/low.
5. SL: Place at Line 2.
Tips:
Find setups where price had the smallest amount of consolidation prior to taking off. We don't want too many candles in a consolidation prior to taking off.
There you have it. Before I share chart markups, I want YOU to post a chart markup so I can actually see if people understand what I wrote. Hit me up with any questions.
Note: There will be another concept called psychological price levels that will be used in conjunction with S&D setups. However, I will not introduce it immediately until there is traction in the thread and people are familiar with S&D first.
EDIT: Go to https://www.forexfactory.com/thread/...1#post14288421 for psych level introduction.
If you haven’t already done so join the Discord server for exclusive setups I share daily with the members:
https://discord.gg/TquBMt8KY5
Also, the Telegram channel is here for major announcements:
https://t.me/+0LnCla4fPAozZjRh
I hold bootcamps to go over all the trading techniques I use which is far too difficult to put in writing. I usually perform a bootcamp once per month if there is enough interest so please be sure to DM me or email me at [email protected] if you are interested and I can put your name on the list.
Udemy Forex Course: https://shorturl.at/blz27