Hi SG and thank you for the new trading idea!
I like the concept for predicting the cross price and I will dive deep into this until I can trade it with confidence.
I've read the thread and I think I understand the concept, but could you please summarize what each element of the diagram means? I can see that the indicators have evolved during development and I think a legend would help newcomers better understand the chat and indie functionality.
Thank you very much!
Legend:
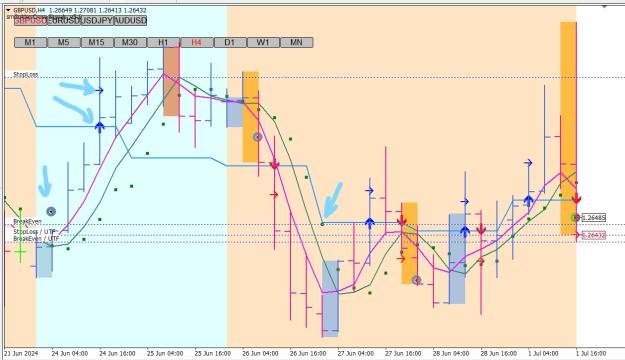
- The small green dots are the predicted prices at which a cross of the two 5-GDs can take place.
- The brown rectangles are possible "Stop" entry prices. (cant find it on these two charts)
- Trend is defined as the position of the GD-Close relative to the GD-Open
- UpperTrend is the trend of the upper timeframe (D1 for H4, W1 for D1) as a background color.
- Open is open of the bars in the current TimeFrame
- I calculate the predicted cross price mathematically
In the charts, the forecast cross prices are the small green rectangles, and the stair-shaped blue line is calculated for the upper time frame.
Is this correct?
Whats do these 4 elements mean?
I think that the bigger arrows are drown when the price crosses the upper trend blue line, right?
But what is the mean of smaller arrows and is their position important?
I see one green circle and many green rectangles, right?
And I see 4 bigger circles, what do they tell us?
Thank you for your time and support!
I like the concept for predicting the cross price and I will dive deep into this until I can trade it with confidence.
I've read the thread and I think I understand the concept, but could you please summarize what each element of the diagram means? I can see that the indicators have evolved during development and I think a legend would help newcomers better understand the chat and indie functionality.
Thank you very much!
Legend:
- The small green dots are the predicted prices at which a cross of the two 5-GDs can take place.
- The brown rectangles are possible "Stop" entry prices. (cant find it on these two charts)
- Trend is defined as the position of the GD-Close relative to the GD-Open
- UpperTrend is the trend of the upper timeframe (D1 for H4, W1 for D1) as a background color.
- Open is open of the bars in the current TimeFrame
- I calculate the predicted cross price mathematically
In the charts, the forecast cross prices are the small green rectangles, and the stair-shaped blue line is calculated for the upper time frame.
Is this correct?
Whats do these 4 elements mean?
I think that the bigger arrows are drown when the price crosses the upper trend blue line, right?
But what is the mean of smaller arrows and is their position important?
I see one green circle and many green rectangles, right?
And I see 4 bigger circles, what do they tell us?
Thank you for your time and support!
Attached Image (click to enlarge)