In my first post on this site, I discussed my HFT indicator va-mod injector for metatrader 4, it distributes several test files and was very well accepted mainly by supporters of automation in binary options.
As everything tends to evolve as long as there is an environment conducive to this, tradingvew provides resources that are little explored by programmers and, if well exploited, can provide the creation of great instruments for the financial market.
Some say that tradingview does not have enough graphical resources, but I believe that those who think so are only familiar with the aesthetics and not with the efficiency of what can be created.
In fact, there are platforms that aesthetically allow us to create a real disney to make the eyes of potential future customers shine, they love all of that.
The brighter and more beautiful, the more they desire.
However, over time they understand that beauty can do nothing for them if it does not also have the functionality and objective of generating high quality signals, because: The reason that everyone in this market looks for instruments that help them in their trading consists of making a profit.
The reason for such an extensive text makes my objective clear here and more: Lovers of the illusion of beauty have not reached this point and will have already abandoned reading this topic.
Some ask why I sell my instruments and that is for a few reasons.
One of them, the passion for programming.
For those who program any type of system, they have nothing less than the desire that it be useful to others, functional and spread around the world like wildfire, as this carries their brand, their name and their legacy, their way of seeing the world through your eyes.
This involves more than just creating variables organized in language for computers and systems, it involves a lot of poetry and organizing them so that the results generated are different from what others have created and efficient in their results.
So it is not enough just to use what is available, it is necessary to create new possibilities, to bring something new to the world in a way that it has never seen and to solve the problem that many, alone, find extremely difficult.
And what does it involve? To start, more than 10 years of specialized studies in programming in several different languages, how to study and become fluent in a new language.
Along with that, more than 10 years in the financial market, with successes and failures, joys and sorrows that cannot be shared here.
So, putting all the factors together add up to more than 20 years and thousands of hours of experience on what to do and what not to do and still try something new to get a new result.
So to open this topic guide you that:
If you don't know what you truly want as a profession, don't go ahead because this is not for you.
It would be a crime to provide something so precious and life-changing to someone who doesn't know what they want and still doesn't understand their place in the world or in life.
The smartest minds in the world are in the financial market, and they are not out there generating test indicators for you to test.
To enter this ocean, be willing to swim.
======================------------------------------=====================-----------==========
After these opening words, I've been analyzing the possibilities of predicting tops and bottoms on a chart and how we've approached this.
As time goes by, I only see specialists saying that the indicators that show us overbought or oversold zones are a thermometer for us to look for regions where the price can carry out a possible reversal.
Others say that support and resistance would be the best option.
But how in fact, technically have we observed when the price arrives in these regions? What guarantees us that he will actually stop there and change direction? NOTHING... exactly that, nothing can guarantee that in fact the price will change direction, looking at it from the point of view that we have been taught so far.
But now let's look at it differently and understand if the results can change.
A change of at least 1 candlestick would be enough for us to obtain good results and therefore we only need a small movement in favor of our order.
The dynamics of the candles change at every moment, regions where they were support and resistance can cease to be in milliseconds and overbought or oversold zones can go even further than imagined and seem to have no end in that direction .
So how can we take advantage of it?
It was then that looking for answers to these questions that I deduced that it is not necessary to be sure where the price is going, but we need to learn to obey what it gives us and not our own conceptions about what should happen at these times.
So I want to know when the price reaches certain regions, what does it say it will do, even if it is at resistance and overbought, does it say it can still go up even more? and in what form does he tell us this?
Simple: The volume says it all, because: If the prweco reaches a resistance region and there is an absurd effort in the majority of buyers at that moment, then we will probably have a change of direction.
And how do we know this information? Tradingview does not have an order book, but it allows us to obtain external data through a connection of addresses in the pine script code, this can be useful when we want even more accurate data about what is happening in the intrabar moment, within each candle.
This allows us to understand if at that moment we have a weakness or strength in the candle for decision making.
Unfortunately, in the forex market, we cannot obtain the real volume of the candles, but we can simulate the closest to the real through the volume of ticks, where: a greater volume of buyer ticks indicates a greater number of purchases in volume,
It will never be as accurate as real volume but it will allow us to get good trading signals.
Sometimes with some flaws that we will try to correct due to the number of ticks in each bar depending on the broker or bank from which the data is coming, which may cause a difference between your broker's charts and the data coming from the collection bank, but even so with the purpose of generating good signals.
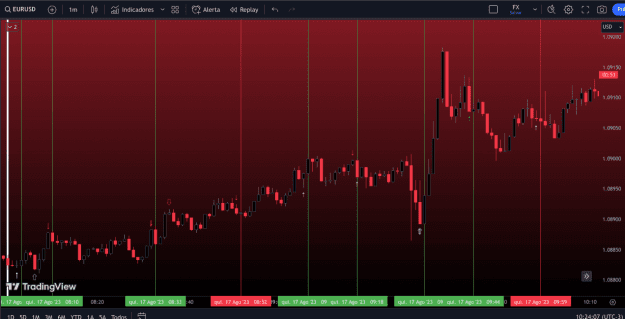
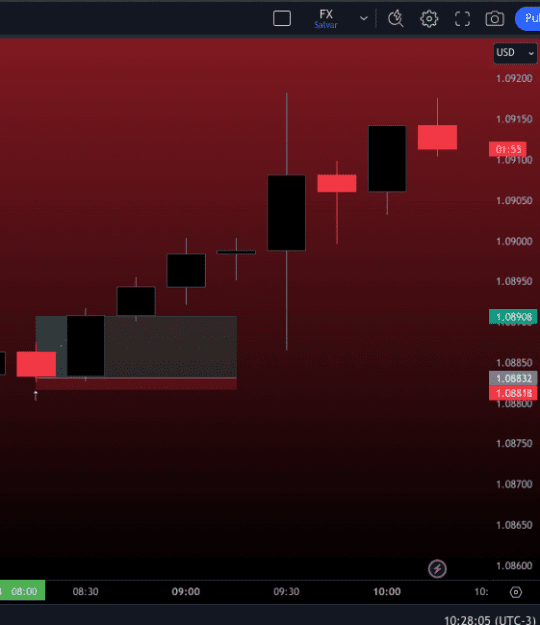
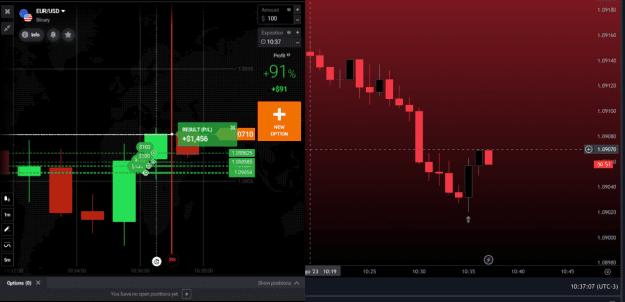
Observe in the image below the initial signs of this project.
It looks promising and will soon be available to anyone who wants to get it.
The signal is always issued for the next candle, giving the trader the right moment to perform the trade.
It can be used for scalping on smaller timeframes and binary options or used for trading on larger timeframes to trade larger moves as seen in the images below:
As everything tends to evolve as long as there is an environment conducive to this, tradingvew provides resources that are little explored by programmers and, if well exploited, can provide the creation of great instruments for the financial market.
Some say that tradingview does not have enough graphical resources, but I believe that those who think so are only familiar with the aesthetics and not with the efficiency of what can be created.
In fact, there are platforms that aesthetically allow us to create a real disney to make the eyes of potential future customers shine, they love all of that.
The brighter and more beautiful, the more they desire.
However, over time they understand that beauty can do nothing for them if it does not also have the functionality and objective of generating high quality signals, because: The reason that everyone in this market looks for instruments that help them in their trading consists of making a profit.
The reason for such an extensive text makes my objective clear here and more: Lovers of the illusion of beauty have not reached this point and will have already abandoned reading this topic.
Some ask why I sell my instruments and that is for a few reasons.
One of them, the passion for programming.
For those who program any type of system, they have nothing less than the desire that it be useful to others, functional and spread around the world like wildfire, as this carries their brand, their name and their legacy, their way of seeing the world through your eyes.
This involves more than just creating variables organized in language for computers and systems, it involves a lot of poetry and organizing them so that the results generated are different from what others have created and efficient in their results.
So it is not enough just to use what is available, it is necessary to create new possibilities, to bring something new to the world in a way that it has never seen and to solve the problem that many, alone, find extremely difficult.
And what does it involve? To start, more than 10 years of specialized studies in programming in several different languages, how to study and become fluent in a new language.
Along with that, more than 10 years in the financial market, with successes and failures, joys and sorrows that cannot be shared here.
So, putting all the factors together add up to more than 20 years and thousands of hours of experience on what to do and what not to do and still try something new to get a new result.
So to open this topic guide you that:
If you don't know what you truly want as a profession, don't go ahead because this is not for you.
It would be a crime to provide something so precious and life-changing to someone who doesn't know what they want and still doesn't understand their place in the world or in life.
The smartest minds in the world are in the financial market, and they are not out there generating test indicators for you to test.
To enter this ocean, be willing to swim.
======================------------------------------=====================-----------==========
After these opening words, I've been analyzing the possibilities of predicting tops and bottoms on a chart and how we've approached this.
As time goes by, I only see specialists saying that the indicators that show us overbought or oversold zones are a thermometer for us to look for regions where the price can carry out a possible reversal.
Others say that support and resistance would be the best option.
But how in fact, technically have we observed when the price arrives in these regions? What guarantees us that he will actually stop there and change direction? NOTHING... exactly that, nothing can guarantee that in fact the price will change direction, looking at it from the point of view that we have been taught so far.
But now let's look at it differently and understand if the results can change.
A change of at least 1 candlestick would be enough for us to obtain good results and therefore we only need a small movement in favor of our order.
The dynamics of the candles change at every moment, regions where they were support and resistance can cease to be in milliseconds and overbought or oversold zones can go even further than imagined and seem to have no end in that direction .
So how can we take advantage of it?
It was then that looking for answers to these questions that I deduced that it is not necessary to be sure where the price is going, but we need to learn to obey what it gives us and not our own conceptions about what should happen at these times.
So I want to know when the price reaches certain regions, what does it say it will do, even if it is at resistance and overbought, does it say it can still go up even more? and in what form does he tell us this?
Simple: The volume says it all, because: If the prweco reaches a resistance region and there is an absurd effort in the majority of buyers at that moment, then we will probably have a change of direction.
And how do we know this information? Tradingview does not have an order book, but it allows us to obtain external data through a connection of addresses in the pine script code, this can be useful when we want even more accurate data about what is happening in the intrabar moment, within each candle.
This allows us to understand if at that moment we have a weakness or strength in the candle for decision making.
Unfortunately, in the forex market, we cannot obtain the real volume of the candles, but we can simulate the closest to the real through the volume of ticks, where: a greater volume of buyer ticks indicates a greater number of purchases in volume,
It will never be as accurate as real volume but it will allow us to get good trading signals.
Sometimes with some flaws that we will try to correct due to the number of ticks in each bar depending on the broker or bank from which the data is coming, which may cause a difference between your broker's charts and the data coming from the collection bank, but even so with the purpose of generating good signals.
Observe in the image below the initial signs of this project.
It looks promising and will soon be available to anyone who wants to get it.
The signal is always issued for the next candle, giving the trader the right moment to perform the trade.
It can be used for scalping on smaller timeframes and binary options or used for trading on larger timeframes to trade larger moves as seen in the images below:
Attached Image(s) (click to enlarge)