Hi All,
I am posting my no indicator intraday system for you to use as your own.
I will go through the system from start to finish and when completed I will post live trades and answer any questions you have.
The system is based on support and resistance of which I can use daily, 4hr, 1hr, 30m and 15m to establish a trade entry.
I do not get it right everyday so no promises.
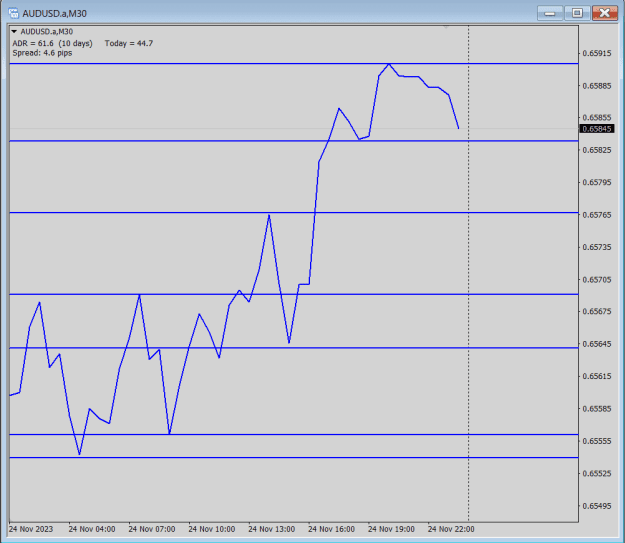
All support and resistance is marked up / plotted on a line chart.
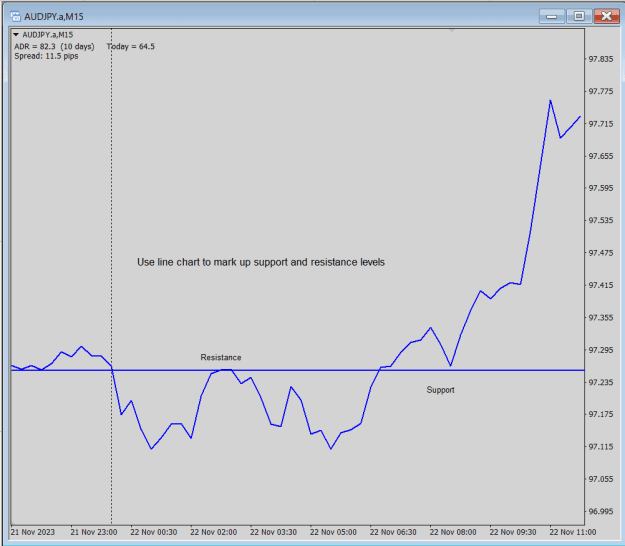
Lets look at some different time frames so you get the general idea.
Plot horizontal lines on the most recent peaks and troughs.
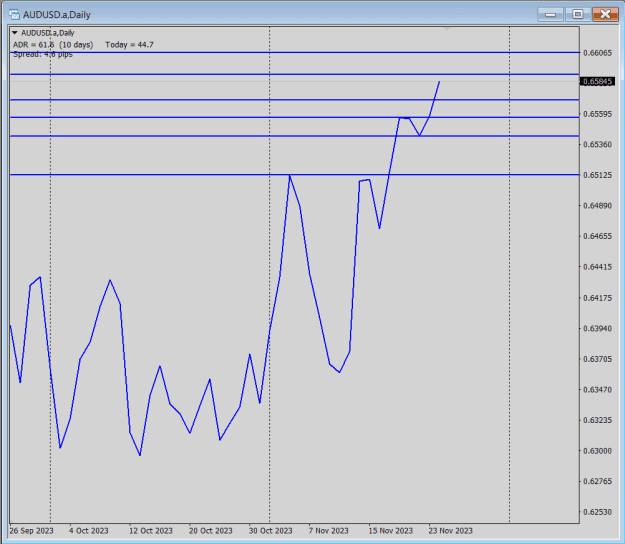
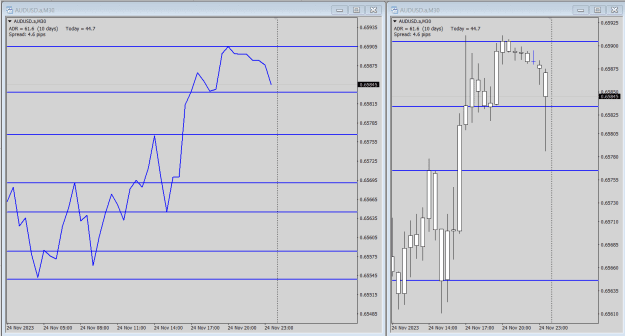
Now change time frame to 4hr chart.
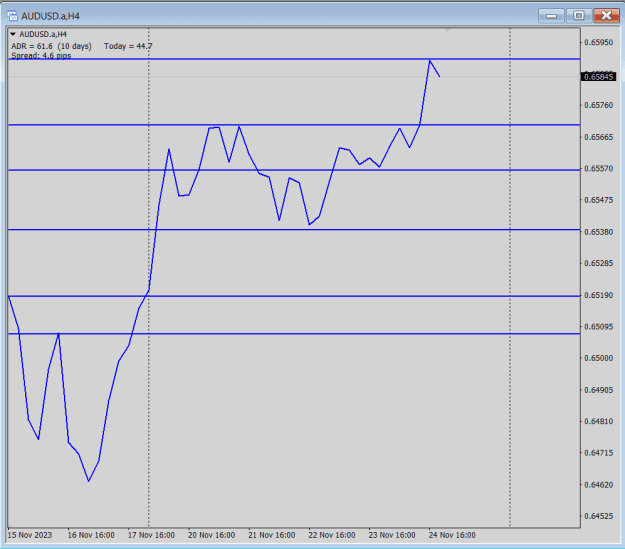
Adjust the lines so that the daily lines are on the 4hr peaks and trough
The following chart shows the 4hr lines before adjustment to 30m.
Now do the same to the 30m chart so it looks like this.
I will get to 15m charts shortly.
Notes on support and resistance.
The support and resistance lines will not always line up perfectly, sometimes they will but most of the time not, you just have to work with what you have got, you need to be flexible.
The next chart / charts I want to discuss is my trading screen. I have two charts open all the time, one is line SR and the other is a candlestick chart with recent SR lines added. If you do not have room on your screen for two charts you can set up a line chart and toggle between line and candles.
Support and Resistance Lines
SR lines are basically a price where there is a strong change in belief has occurred of the market price / currency value.
They are reaction / rejection points that we can use to our advantage.
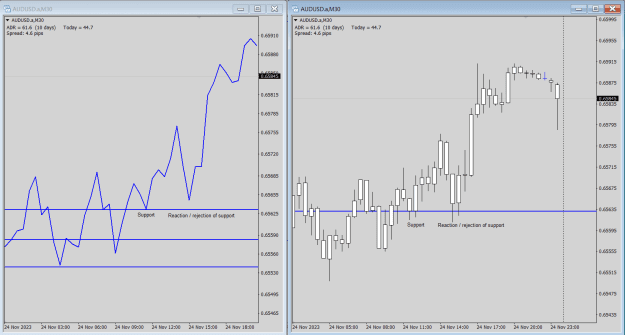
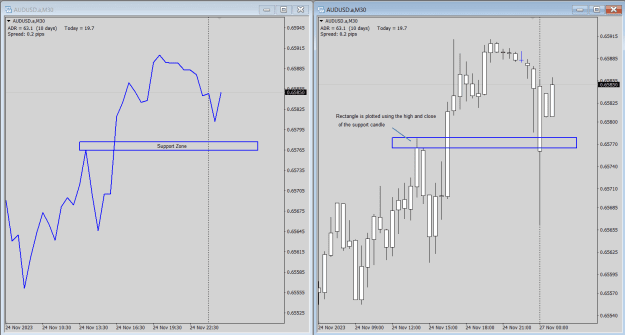
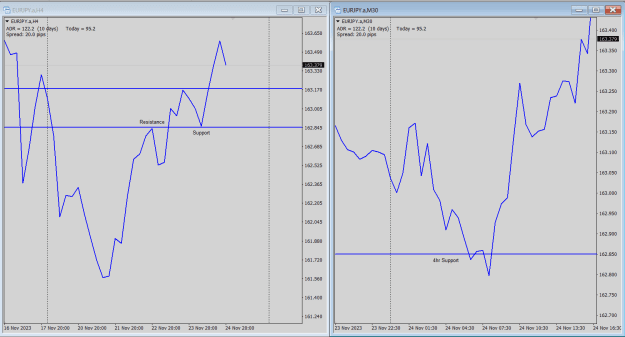
SR is visible on all time frames. The following chart shows 4hr SR and 30m chart with 4hr SR plotted
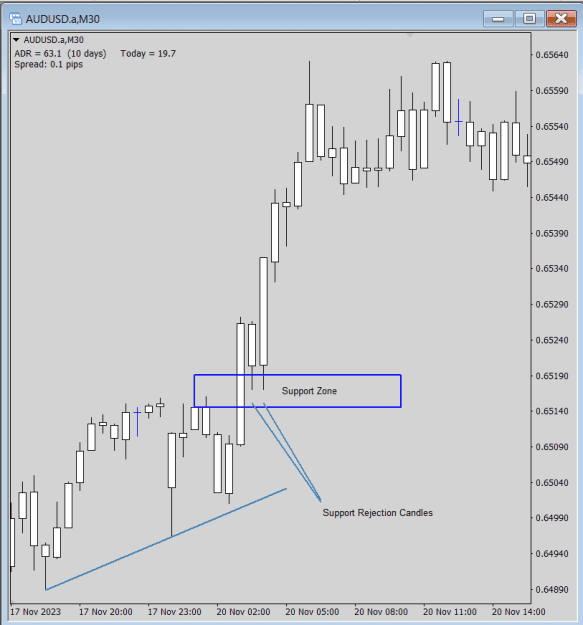
The next chart is the 30m candle chart showing rejection candles
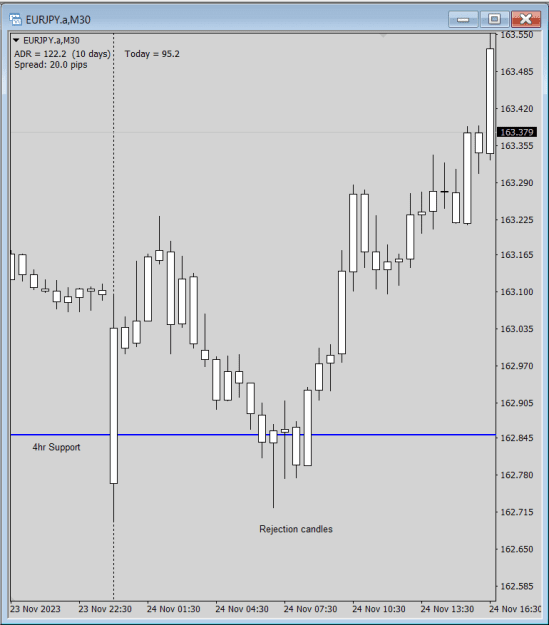
We now have a support zone and rejection candles. Next we want to get into the trade and this you will find interesting.
The majority of traders enter trades when everything lines up in their favor, I am talking moving averages, MA crossovers, MACD bullish etc.
If you use this approach you will find it difficult to succeed with any trading system.
I will explain....
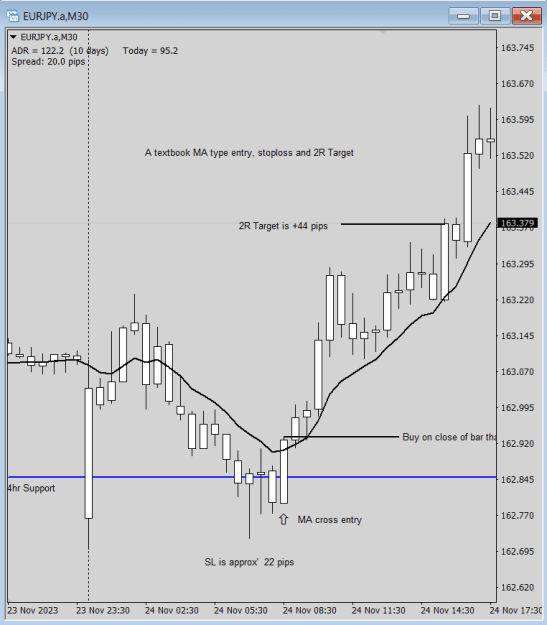
The following chart shows a textbook Close above MA type trade. The only problem is you are giving away way to much of your funds in the stoploss.
More to follow.......
I am posting my no indicator intraday system for you to use as your own.
I will go through the system from start to finish and when completed I will post live trades and answer any questions you have.
The system is based on support and resistance of which I can use daily, 4hr, 1hr, 30m and 15m to establish a trade entry.
I do not get it right everyday so no promises.
All support and resistance is marked up / plotted on a line chart.
Attached Image (click to enlarge)
Lets look at some different time frames so you get the general idea.
Plot horizontal lines on the most recent peaks and troughs.
Attached Image (click to enlarge)
Now change time frame to 4hr chart.
Attached Image (click to enlarge)
Adjust the lines so that the daily lines are on the 4hr peaks and trough
The following chart shows the 4hr lines before adjustment to 30m.
Attached Image (click to enlarge)
Now do the same to the 30m chart so it looks like this.
Attached Image (click to enlarge)
I will get to 15m charts shortly.
Notes on support and resistance.
The support and resistance lines will not always line up perfectly, sometimes they will but most of the time not, you just have to work with what you have got, you need to be flexible.
The next chart / charts I want to discuss is my trading screen. I have two charts open all the time, one is line SR and the other is a candlestick chart with recent SR lines added. If you do not have room on your screen for two charts you can set up a line chart and toggle between line and candles.
Attached Image (click to enlarge)
Support and Resistance Lines
SR lines are basically a price where there is a strong change in belief has occurred of the market price / currency value.
They are reaction / rejection points that we can use to our advantage.
Attached Image (click to enlarge)
SR is visible on all time frames. The following chart shows 4hr SR and 30m chart with 4hr SR plotted
Attached Image (click to enlarge)
The next chart is the 30m candle chart showing rejection candles
Attached Image (click to enlarge)
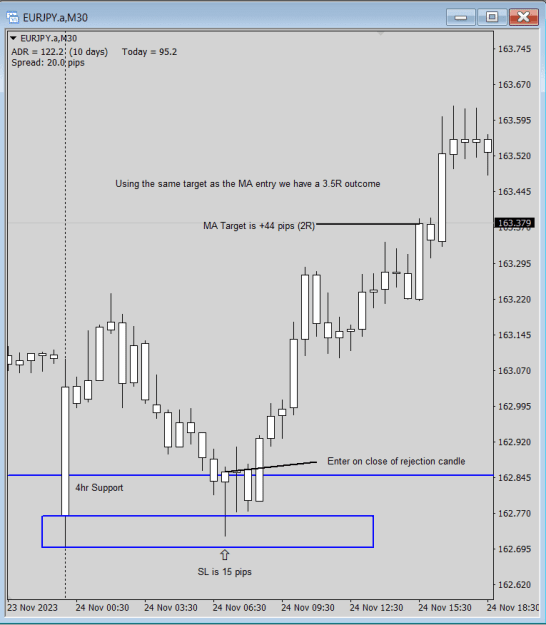
We now have a support zone and rejection candles. Next we want to get into the trade and this you will find interesting.
The majority of traders enter trades when everything lines up in their favor, I am talking moving averages, MA crossovers, MACD bullish etc.
If you use this approach you will find it difficult to succeed with any trading system.
I will explain....
The following chart shows a textbook Close above MA type trade. The only problem is you are giving away way to much of your funds in the stoploss.
Attached Image (click to enlarge)
More to follow.......
Your trade order needs to be in the right place at the right time.