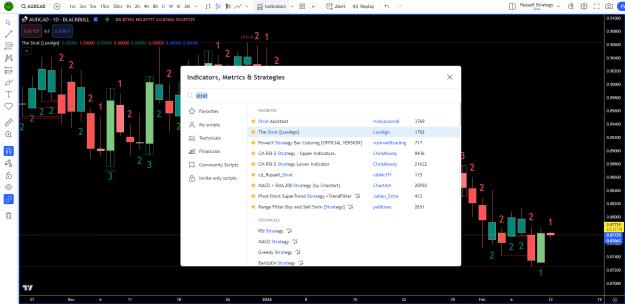
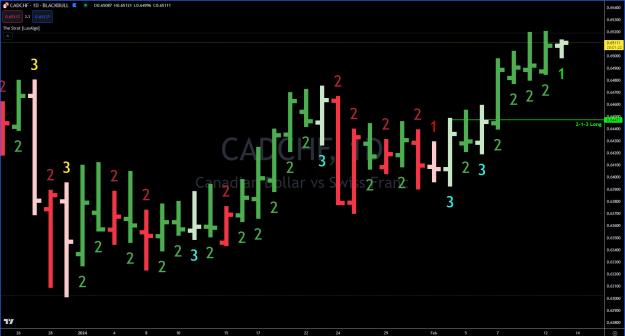
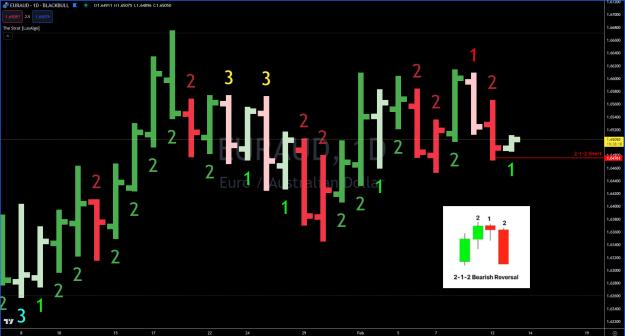
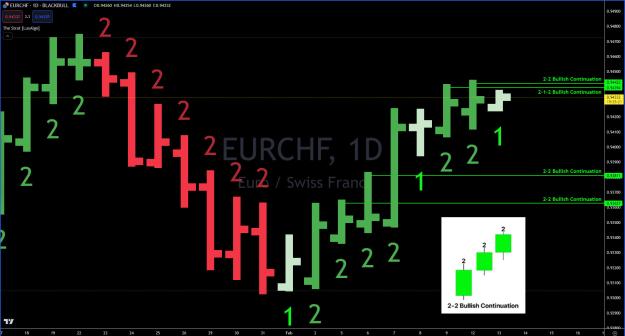
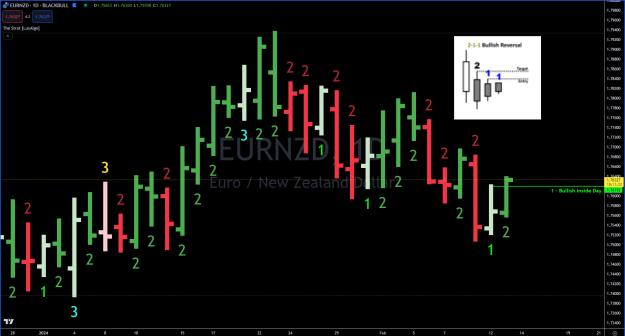
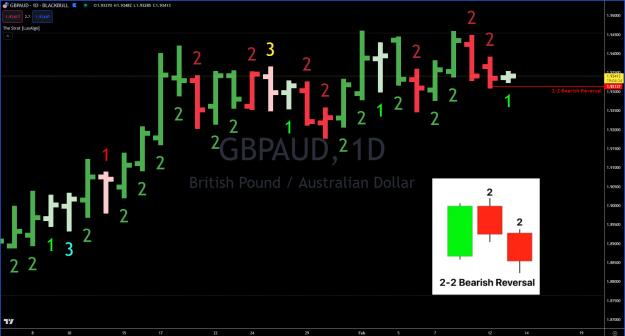
DislikedThere is a complere set of strat indicators in tradingview if anyone interested, including one marking the candles with correct numbers and one telling you if your selected htf candles are aligned same directionIgnored
- Joined Jul 2011 | Status: Member | 7,823 Posts
If you trade like me, you'll be homeless and broke within a week.
Goldilocks All Time Return:
-28.2%
- Joined Aug 2010 | Status: Member | 238 Posts
We don't see things as they are; we see things as we are. MantisClaw
- Joined Jul 2011 | Status: Member | 7,823 Posts
If you trade like me, you'll be homeless and broke within a week.
Goldilocks All Time Return:
-28.2%
- Joined Jul 2011 | Status: Member | 7,823 Posts
If you trade like me, you'll be homeless and broke within a week.
Goldilocks All Time Return:
-28.2%
- Joined Jul 2011 | Status: Member | 7,823 Posts
If you trade like me, you'll be homeless and broke within a week.
Goldilocks All Time Return:
-28.2%
- Joined Jul 2011 | Status: Member | 7,823 Posts
If you trade like me, you'll be homeless and broke within a week.
Goldilocks All Time Return:
-28.2%
- Joined Jul 2011 | Status: Member | 7,823 Posts
If you trade like me, you'll be homeless and broke within a week.
Goldilocks All Time Return:
-28.2%
- Joined Jul 2011 | Status: Member | 7,823 Posts

If you trade like me, you'll be homeless and broke within a week.
Goldilocks All Time Return:
-28.2%
- Joined Jul 2011 | Status: Member | 7,823 Posts
If you trade like me, you'll be homeless and broke within a week.
Goldilocks All Time Return:
-28.2%
- Joined Jul 2011 | Status: Member | 7,823 Posts
If you trade like me, you'll be homeless and broke within a week.
Goldilocks All Time Return:
-28.2%
- Joined Jul 2011 | Status: Member | 7,823 Posts
If you trade like me, you'll be homeless and broke within a week.
Goldilocks All Time Return:
-28.2%