I started this thread to post my analysis and real time trades as it happens. I used to post at Bella's Zero that is closed.
History as a Trader
I started trading in September end 2022 so basically i just completed my 1st year in OCT 2023 . I trade only GBPUSD and will stick to this pair for personal preferences ...
Systems Used on this Thread
1. Bella's Pivot Quantum: This is Market Timing and Forecasting Analysis indicator based on Pivot Points that i developed for trading cable. The Analytical Engine does internal pattern recognition on Daily Bar to provide analysis for the upcoming day. Analytical Engine calculates both reversals in Trend and Continuation in Trend.
2. Bella's 0.25: This is special trend that is calculated on Currency rather on Time Frame ( for more information on 0.25 please see below )
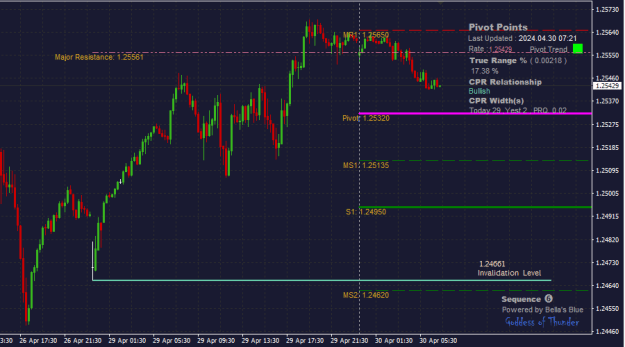
Bella's Pivot Quantum
Pivot Quantum offers objective and consistent trading using pattern recognition. It uses prior Daily Trading Bar information to calculate
- Swing Reversals
- Trend Continuation
Basically Quantum is Advanced Candlestick Analyzer written by myself from ground up. The Analytical Engine provides real time trading opportunity as the forecast is provided on the open of the daily bar for real time trading decisions.
... waiting for an image
Pivots
Understanding Markets ( Pivot Points)
Auction Process
The role of the marketplace is to facilitate trade between buyers and sellers. Price will auction higher and lower as it attempts to find an area where trade can easily be facilitated. If price opens too low, it will auction higher to find sellers, and if price is too high it will auction lower to find buyers.
Price continually moves higher and lower in search of the best value to both buyers and sellers. Buyers will enter the market when they feel price is below value, while sellers will enter the market when they believe price is above value.
So the No 1 Question now is what is the meaning of Value? İn context of Forex and Pivot Points.
Value = Pivot Point ( Calculation as Follows )
(Yesterday's High + Yesterday's Low + Yesterday's Close ) / 3
Pivot Point : This is the focal point or the mean , which is derived from the collective market data from prior session's high,low, and close price.It is the strongest of the support and resistance numbers. Prices normally trade above or below this area before breaking in one direction.
In real life we use this concept on daily basis lets see a quick example using Shopping.
Meet Mr.Scot who is a fantastic shopper when it comes to food , clothes but throws all of his instinct when it comes to trading. Scot loves to eat Prawns, but he knows that this can be an expensive habit, so he must buy when the price of the prawns is below value.
Mr.Scot keenly observes the price of prawns regularly and knows that the average price per pound is about $10.99. As you can expect, when the price per pound drops to $6.99 he pounces on the offer and buys several pounds.
++ important considerations
Average Price = Pivot Point
Price Dropping to $6.99 is equals to finding Support at Daily Support1
On the other hand Mr.Scot opened his own Prawns Shop and is unsure of market value of his prawns and initially lists for $20.00 per KG. The market clearly sees this price as below value , as evidence by the boom of orders he receives. He sold 100 KG in his 1st Week and is extremely excited.. However, he decides to raise the price to $30 KG to see how the market will respond. He is delighted to see that his orders remained constant at 100 KG per week, meaning that buyers still feel that her prawns should be valued at current price.He feels the need to probe even higher to maximize the profit potential,therefore, he raises the price to $60.00 KG . This time, however, the market responded with fewer orders to buy and he only sold 25KG orders. He quickly reinstates the $30.00 price tag and feels confident that he has reached fair value of his prawns.
++important considerations
- We don't know the average price ( other companies are selling ) Pivot Point
- $60 KG is too expensive and represents either Daily Resistance 1 or 2
Conclusion: This explains why you will see price rally through resistance only to sell off sharply, or drop through support only to rally with conviction.
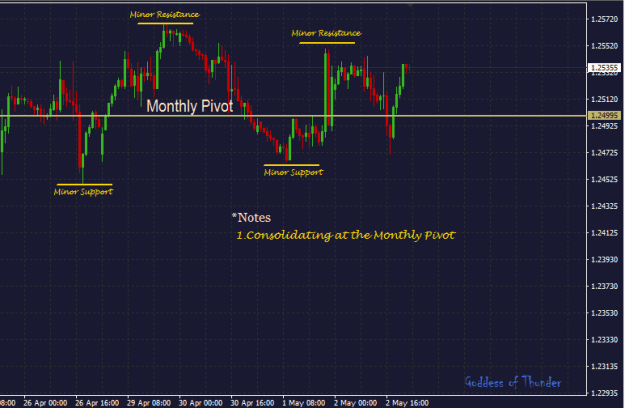
Advantages of Using Monthly Pivots
The higher time frame pivots inspire different types of market participants ( traders ) to enter and exit the market. Namely, Monthly pivots inspire swing traders and position traders participation.
Understanding this paradigm will help you understand which group of market participants are influencing price behavior, which allows you to gauge price conviction.
Concept of Smart Money: Smart money is the funds that are under control of institutional investors , central banks , fund market mavens , and other financial individuals and entities. They may not use Pivots but they could easily be located by using Monthly Pivots.
Monthly and Weekly Pivots
I previously mentioned "Smart Money" as the capital controlled by institutional investors, central banks, etc. Although we cannot know what system they use, we can locate them using Monthly Pivots. For instance, take my short from 09.04.2024 until 23.04.2024. I entered on 09.04 and also on 18.04. The 4-hour chart shows the smart money went short from Monthly Pivot 1.27078 till yesterday 1.22989.
Traders who will trade this move are known as “Position Traders” and trade off Monthly Pivots. If they use Weekly Pivots instead, they are called “Swing Traders” who keep trades for more than a few days and generally are traders that are placing themselves during some type of retracement with the main trend.
The weekly pivots can be used by swing traders who are looking for retracement trades in the direction of the main trend started by Position Traders. If you're interested in learning more about pivots, please research them on the internet.
Remember, Position Traders use Monthly Pivots, while Swing Traders use Weekly Pivots.
Projecting Today's High and Low using Pivots.
During trading, sometimes it is important to find out what could be Today's High and Today's Low of the Day. One Technique popularized by a Trader named Thomas Demark ( a well-known Technical Strategist ) is using previous days' highs and lows which directly correlate in some ways to pivot points. I will provide the calculations below which could be used with already qualified trading strategies as I believe these figures have little use when used stand-alone.
Friday's Data on Cable is as Follows. ( 22.03.2024 )
High = 1,26746 , Low = 1,25747 , Close = 1,25999
We also need to know if the close was < open or > open ( it is important to use the right calculation for given data ).
Using CLOSE < OPEN ( Friday's Data)
Get the Monday's High & Low ( 25.03.2024)
Steps as Follows.
1. X = 2 x Low = 2.51494
2. Add High = 3.7824
3. Add Close = 5.04239
4. Div X with 2 = 2.521195 (let's call it Y )
5. Subtract Y with High = 1.25373
Monday's Low = 1.25373
6. Subtract Y with Low = 1.26372
Monday's High = 1.26372
Expected High and Lows Projections for Monday date 25.03.2024 High: 1.26372 and Low: 1.25373
Now Suppose the Close of Yesterday > Open such as on the date 20.03.2024 the clac for next is as follows.
Using CLOSE > OPEN ( Wednesday's Data )
High = 1.27865 , Low = 1.26840 and Close = 1.27859
Steps as Follows.
- X = 2 x High = 2.5573
- Add Low = 3.8257
- Add Close = 5.10429
- Div X with 2 = 2.55214 (Let's call it Y )
- Subtract Y with High = 1.27349
Thursday's Low = 1,27349 - Subtract Y with Low = 1,28374
Thursday's High = 1.28374
Expected High and Lows Projections for Thursday date 21.03.2024 High: 1.28374 and Low: 1.27349
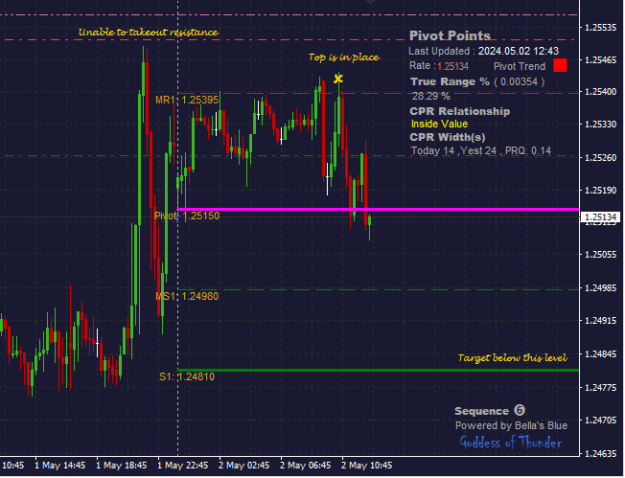
Why use Pivot Width Analysis.

Pivot Width Analysis allows you to forecast the likelihood of a market experiencing either a trading range or trending phase. This approach allows you to easily forecast expansions and breakouts opportunities.
Compression leads to Expansion..
Narrow Value ( 13.05.2024 , Width = 2 compared to 25 on 10.05.2024 )
a narrow value implies an increase in volatility with breakout potential.
Wide Value (14.05.2024 , Width = 13 compared to 2 on 13.05.2024)
After an expansion phase, wide value area tend to develop. Which suggests an upcoming trading range market.
There were 2 Question which require answering ( let's revise the Ques again)
- Q1. Lets say Friday is 25 and Monday is 2 ( which is Truth ) how do i know this is "tight"?
- Q2. Lets say Monday it was 2 but Tuesday it shows 13 .. This is possibly still tight ?
We need a way to quantify the Narrow value and Wide value. One way to solve this problem is to relate the value areas with Expansion and Compression percentages ( you may have seen this phenomena with Bollinger Bands, they contract and expand?).. Good .
Narrow Value: To Quantify Narrow Width Value we will use 65% of compression of prior day's value. In other words if the Pivot Width of today has decreased 65% or more from yesterday's Pivot Width we shall call it “Narrow Value”.
Example :
Friday 10.05.2024 , Width = 25
Monday 13.05.2024 , Width = 2
Performing Calc to check if the criteria is met for Narrow Width
Initial = 25
Decrease = 2
Dec Amt = 23
Calc Dec% = 23/25 = 0.92 : Change to Percentage = 92% decrease
Therefore, 92% decrease is more than 65% which states monday has Narrow width area.
Wide Value: To Quantify Wide Value we will use 125% increase in value. If the Pivot Width today has increased 125% or more from prior day's Pivot Width we will call it “Wide Value”.
Example:
Monday 13.05.2024 , Width = 2
Tuesday 14.05.2024 , Width = 13
Performing Calc to check if the criteria is met for Wide Width
Initial = 2
Increase = 13
Inc Amt = 11
Calc Inc% = 11/2 = 5.5 . Change to percentage = 550% increase.
Therefore, 550% increase is more than 125% which states tuesday has Wide width area.
In this paper i covered how to find out if today's Pivot Width is Wide or Narrow using 65% and 125% increase / decrease criteria.
Please note: there maybe more ways to calculate wide or narrow width areas which is left to the reader to research
Bella's Swing Targets and Reversals Calculations
using Mathematical equation to forecast probable support and resistance using only 1 price point.
Data we have is low of 1.24452 placed on 09.05.2024
Calculations are as follows .
- when using Sqrt we omit decimals so 1.24452 becomes 124452
- for Volatility i use 4 in the example below i add 4 to the result in step 1 (add/subtract) this is researched on 4hr for cable only
- Multiply the result with itself in step 3 ( Square roots stuff )
( using windows calculator or excel )
Step 1: Sqrt(124452) = 352.77
Step 2: 352.77 + 4 = 356.77
Step 3: 356.77 * 356.77 = 127290 or 1.27290
The high so far is 1.27262 placed on yesterday, Just below 1.27290
Above calculations which are provided by myself to the thread can be used to obtain price objectives and reversals using only 1 Price .. in this example i used the leg 1.24452 low on 09.05.202
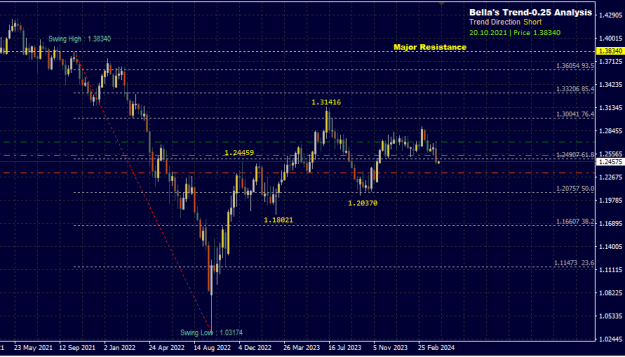
Bella's Trend-0.25
The very first indicator that i created on GBPUSD, Special thing about this analysis is that it doesn't require time frame (Weekly or Monthly) but rather works on Currency. The advantage is that this shows one trend and one support or resistance on every time frame
Revising Weekly Charts using Bella's Trend-0.25.
Currently the analysis states that Resistance 1.38340 will not be taken out by market in near term and the low of 1.03174 placed on 25.09.2022 will be taken out in future.
As an Analyst my job is to use Technical Analysis and follow the market trends for which i later developed more indicators.Since Trend-0.25 is the major trend of the currency it is vital to know the direction it is pointing and it's current resistance. Market can easy go as close as possible but eventually will fall down ( as per analysis )
Posting Rules on the Thread:
Only GBPUSD Charts and Trades are allowed to be posted on this thread. ( Note : Please don't Post any charts which are against my trades )
Bella ( Goddess of Thunder )