This is h4 chart of AUDCAD. It is in downtrend but the last APB candle shows a consolidation. 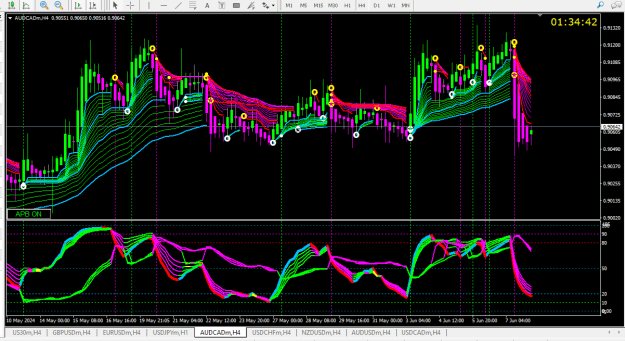
on H1 see the pullback inside the guppies. 
now we wait for gann "trend reversal sell" alert on H1 chart, wait for the candle to close. take a short trade at the close of the candle. stoploss will be swing high on H1 chart and first target R:R 1:1. i trade with 2 lots so if my first target is acheived,i can move to H4 chart for second lot and trailing my stoploss to BE.
hope you understand.
i am working for next 8 hours so i wont be able to take this trade.
check if our charts look the same and tane a trade in demo account.

Attached Image (click to enlarge)
on H1 see the pullback inside the guppies.
Attached Image (click to enlarge)
now we wait for gann "trend reversal sell" alert on H1 chart, wait for the candle to close. take a short trade at the close of the candle. stoploss will be swing high on H1 chart and first target R:R 1:1. i trade with 2 lots so if my first target is acheived,i can move to H4 chart for second lot and trailing my stoploss to BE.
hope you understand.
i am working for next 8 hours so i wont be able to take this trade.
check if our charts look the same and tane a trade in demo account.
3


