Folks, I'm attaching a spreadsheet for you to look over. I use it as a cheatsheat, interested to see if you guys have any comments or suggestions / corrections.
Folks, I'm attaching a spreadsheet for you to look over. I use it as a cheatsheat, interested to see if you guys have any comments or suggestions / corrections.
I posted a link on the live chat as well
Ignored
Nice work !
but why you did it on excel and not on some Painting program
just curious
|
Joined Apr 2009
|
Status: called zol actually
|440 Posts
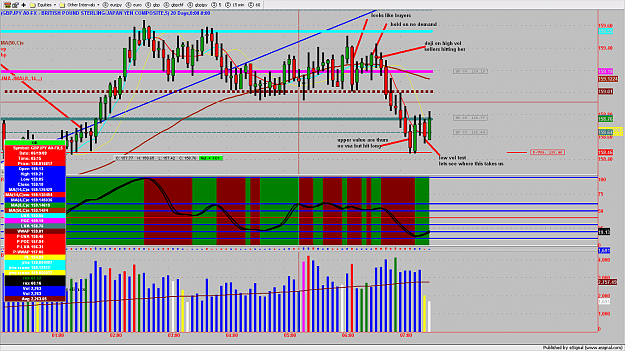
I know this might not have anything to do with VSA but th primary trend seems to be bullish in general to this pair - and to others too.
If one wants to follow the trend nicely for a bigger swing - only visual on 4H or daily time frame - I find it nice idea to pick the enter and the right time using VSA analysis let say once an oversold area is confirmed to b oversold and not breaking through support line. Of course, the primary trend could be assessed from volumes point of view.
Does this make sense or I am in the darkness still?
Ignored
yes but gj follow 30 min
4 hour can whipsaw hell out of you in this market
I think the move back to 160 zone is due to some options expiring up there tomorrow
Folks, I'm attaching a spreadsheet for you to look over. I use it as a cheatsheat, interested to see if you guys have any comments or suggestions / corrections.
I posted a link on the live chat as well
Ignored
Hi Steve
Thanks Steve, Ill check it against the list posted earlier.
This one looks better
1 Question:
does the second marker (not filled) in each frame indicate the bars close or the next bars close, or sthing else maybe?
I think the move back to 160 zone is due to some options expiring up there tomorrow
Ignored
Thank you, this make sense. Having discussed that, I noted that there is definite benefit in at lease monitoring the options market and the futures market, so assumptions could be made on the cash market.
I am learning though and have little idea how to make any conclusions and how to monitor same.
Could you please recommend any literature highlighting the use of connecting the two markets and indeed to learn about options maybe futures?
What would be a way of monitoring options (futures) and the volumes going on there? Esignal?
Your (also other's) response on this is a great help and appreciate, as always.
Thanks Steve, Ill check it against the list posted earlier.
This one looks better
1 Question:
does the second marker (not filled) in each frame indicate the bars close or the next bars close, or sthing else maybe?
Cheers, Dutchy
Ignored
Hi Dutchy
The filled box is the volume, and the vertical line to the right of it is the the spread (see the top of the spreadsheet for more details), and the horizontal bar is the close (top or bottom).
Hope this helps, as I said before there might be mistakes so feel free to question them, in case I've got them wrong!
Joined Dec 2008
|
Status: Resident Psychiatrist!!!
|2,600 Posts
Just want to Vent---
i have practically wasted a month of my life being distracted by other systems on FF--ENOUGH---should have listen to flash--sorry i couldn't test your system--too busy BS'ing
To beginners--if you are fortunate enough to stumble on this thread--stick with it and read everything under the sun on VSA and i promise you your account will overflow-lol-VSA is now definitely my final Path--
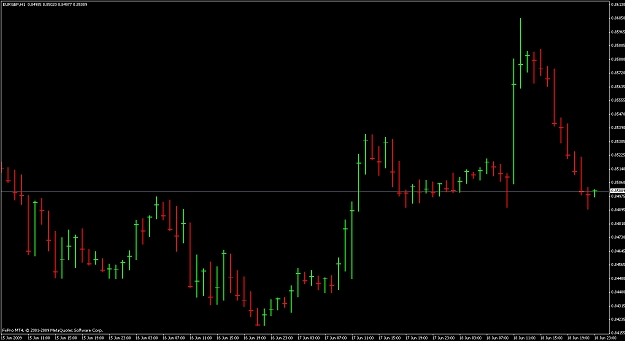
I've attached two screenshots of the identical time frame (5 min) on EURUSD just a few minutes ago, comparing IBFX demo 5 digits versus Alpari UK Demo. Ignore the server times being different, these two images are comparable. I've set the minimum and maximum on the two lower indicators to be the same so its a true compare.
I find it fascinating the massive differences in volume between the two, giving completely different signals.
Any comments? Can anyone post up Esignal to compare? Many thanks, and I hope this thread is useful to show...
Ignored
Well, that begs the question----What about your ENTRY SIGNALS--
i have practically wasted a month of my life being distracted by other systems on FF--ENOUGH---should have listen to flash--sorry i couldn't test your system--too busy BS'ing
To beginners--if you are fortunate enough to stumble on this thread--stick with it and read everything under the sun on VSA and i promise you your account will overflow-lol-VSA is now definitely my final Path--
Ignored
tao . i crawled out of bed with one eye open ..saw that set up stuck out like a sore thumb . Hit it at 159.25 , closed for 70 pip 30 min later. NO volume indie required that draws fancy circles.
I made a quick recode of an old indi.......
you need to put this on chart, and then just go to chart properties
and change coloring of bars to black!!!