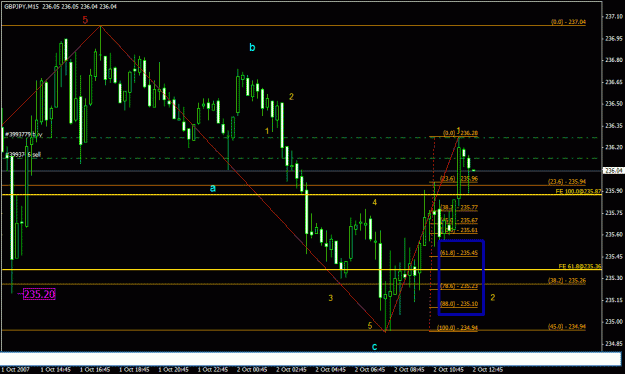
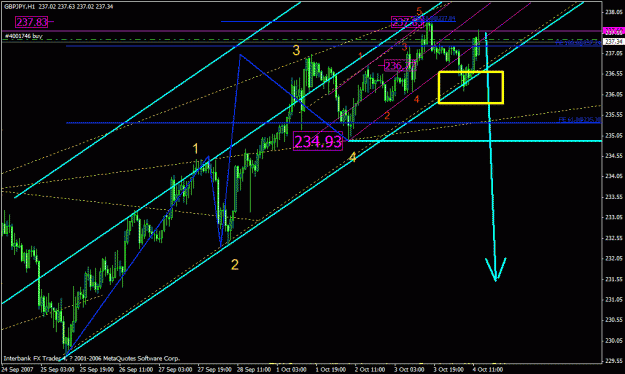
Checking the Technical Indicators,
As price goes to the Pivot Level @ 234.38, it enters the breakout area of previous days LOW.
If a 15m candle opens and closes below previous day's low, then I will next watch for the 4 hr candle. if both open and close below the prevoious day's low @ 234.71, then we may see further fall of this pair towards
233.82
233.50
233.27
233.21 Weekly Pivot
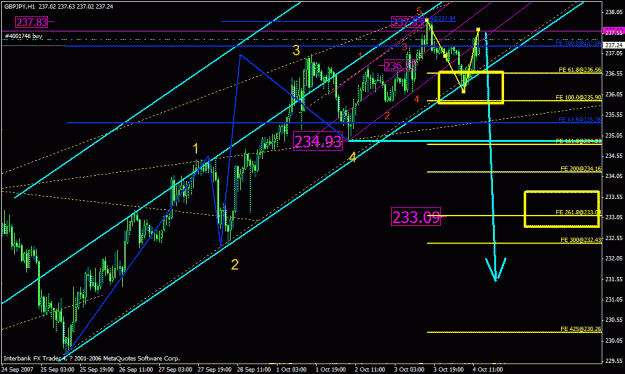
Stochastics on 4hour chart has crossed back below the 80 Level
5m 15m 30m and 1 hr are now oversold. we may see a slight retracement to getthis lower TF stochs to over bought levels before price continues to go down.
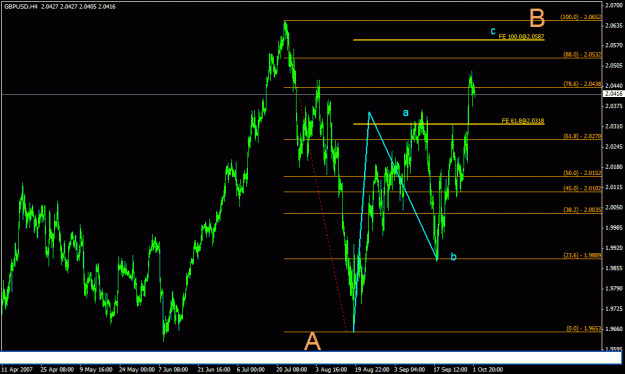
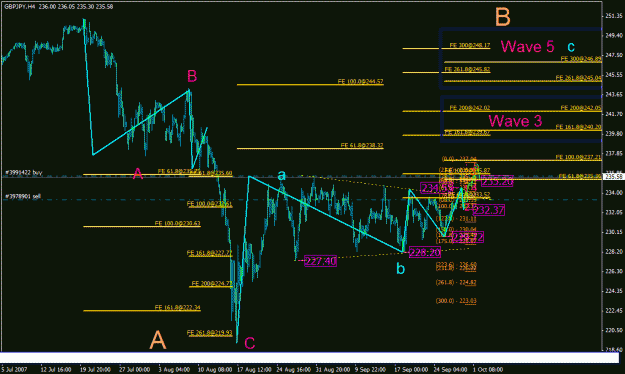
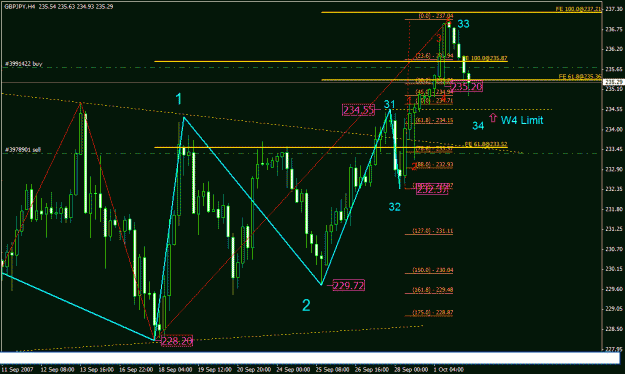
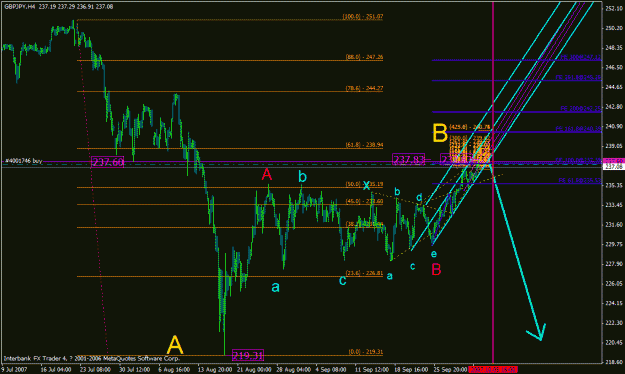
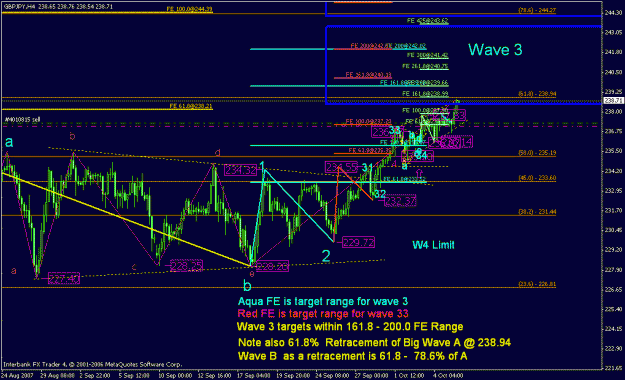
We could be in a C.3.3.4 or a 5.3.3.4 Wave in GBPJPY and this retracement or move down I would consider as the wave 4 retracement in the possible wave count I presented above.
Although the move down may now be limited by the wave 4 requirements which would mean that price retracement should be watched at the following levels:
38.2 - 235.26 may be favored as it is near the 235.20 end of sub wave 4 of prior impulse wave.
50.0 - 234.71
61.8 - 234.15
EG
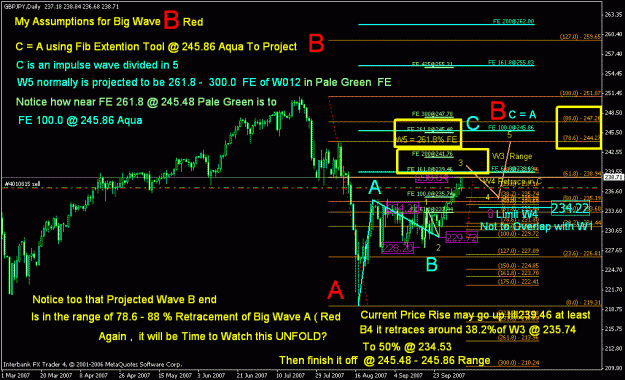
ALL the details above just serve to open our minds to possible levels of support and resistance including projection levels.
As price goes to the Pivot Level @ 234.38, it enters the breakout area of previous days LOW.
If a 15m candle opens and closes below previous day's low, then I will next watch for the 4 hr candle. if both open and close below the prevoious day's low @ 234.71, then we may see further fall of this pair towards
233.82
233.50
233.27
233.21 Weekly Pivot
Stochastics on 4hour chart has crossed back below the 80 Level
5m 15m 30m and 1 hr are now oversold. we may see a slight retracement to getthis lower TF stochs to over bought levels before price continues to go down.
We could be in a C.3.3.4 or a 5.3.3.4 Wave in GBPJPY and this retracement or move down I would consider as the wave 4 retracement in the possible wave count I presented above.
Although the move down may now be limited by the wave 4 requirements which would mean that price retracement should be watched at the following levels:
38.2 - 235.26 may be favored as it is near the 235.20 end of sub wave 4 of prior impulse wave.
50.0 - 234.71
61.8 - 234.15
EG
ALL the details above just serve to open our minds to possible levels of support and resistance including projection levels.