DislikedI see the similarities of your chart to my own. Why did you choose to use the 1.2650 area as the 100% of one of your Fib retracement drawings and not one of the lower highs? I also saw a chart posted by Geppyg where he used the "high" lower than the one I chose to call the first R after we break through the 1.2150 area.
I guess this is where the Fib retracement drawings have always become such an uncomfortable tool for me. When it comes to a chart like E/U (constant downtrend) how do you know what high to use as your starting point to draw...Ignored
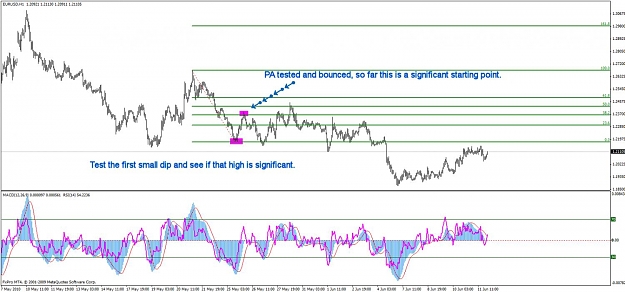
Sorry for the delayed response. When it comes to fibs, you are not alone. There is a lot of ambiguity in how they are drawn, even more so with extension/expansion. Generally, the more Long-Term/Higher-Timeframe you use, the more significant. If you draw a fib on a low timeframe and 61 fib is broken, you need to pull out to a higher timeframe or change direction all together. For my smaller timeframe, I chose 1.2666 as my high. I have a trick for drawing them, first, when you see that the start of a retracement could be less than 23 of your starting point, that will still give you room to retrace and PA to hit those significant levels. So start your fib and draw it to the first dip and see if the first small retrace obeyed the levels; so it came back up to like 38, 50 or 61 and turned right on that level. and continued down. I am probably confusing more than helping. I will walk through the first one slowly and you can draw it with me:
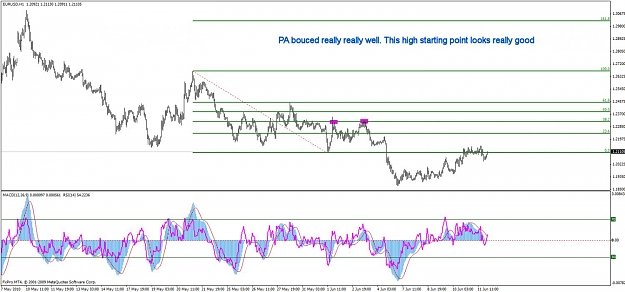
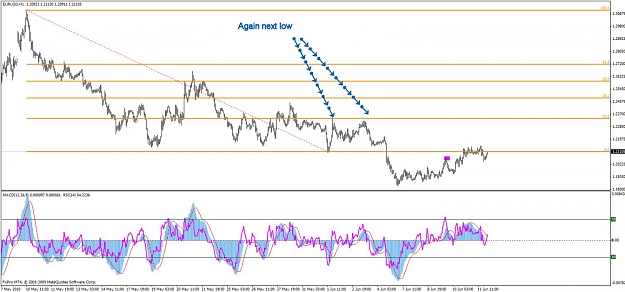
Start you fib on 1.2666 and slowly draw it down to the first little bottom at around 1.2179. So this first little bottom is a small retrace. See if it obeys your fib drawn from that starting point. It does, it turns on 38 fib really well. So this fib could be significant to our longer term dip as this high (starting point) was obeyed in the past. Now take the bottom of that fib and take it down a little further to the next dip, but keep the same starting point, so your fib levels will get a little wider. the next bottom is at like 1.215. You can see that with that bottom, fibs 23 and 38 were slightly obeyed, but 50 was a great turning point. So yet again, this top we chose to start from is looking significant from multiple small bottoms. So let's continue down to the next little bottom further down. 1.21142 is the next small bottom, but keeping the same starting point. This retrace obeyed this fib starting point too. PA bounced on the 38 fib 2 times really hard. So this validates that fib starting point again. Now let's move the bottom of the fib one last drop to the next and final bottom. PA moved and bounced very well at the 23 fib. PA is now range between 23 and 38 fib, but as you will see when you add another fib from a higher high, it is reacting to a 23 fib drawn from another high. But, you have found that PA is obeying your smaller fib really really well. So I would keep this fib on as PA will probably respect it. If PA breaks 61 fib on this one your just drew, then for me, this fib is now invalid and look to the next higher up fib to be your valid short term fib.
I did the exact same thing with my next higher drawn fib at ~1.31. Just take it step by step down to see if it is significant. Once you do this over and over, you will be able to draw multiple time frame fibs fast. Remember, the more obvious the high and low and the higher the timeframe, generally the more significant the fib. I always have in the back of my mind with any S/R or Fib, is the question, "Would someone at a big bank be using this?" If the answer is yes, then your should be good. So any real obvious high and low, or swing, large market movers will probably see too. If you are drawing a fib and you wonder if this is the right place to draw it, then stop right away, because if you are questioning your starting point, then chances are no one significant (PA Movers) is using that as their starting point. If you are drawing from an obvious spot, then you should feel more confident.
Attached Image (click to enlarge)