One could (potentially) "cut corners" with a programme such as ForexTester. It allows you to practice and improve your skills in a shorter period of time. BUT! One has to be "honest" as it's easy to fool oneself by "steping back" via "undo" function.
Also, such a programme allows you to feel the market better as you can see daily moves in 20-30 seconds. So, that way you DO learn to place your order (with TP and SL) and just sit back and wait for the market to move. It's hard to do (initially) with live market (with H4 TF, let alone daily). However, after demoing with ForexTester one shouldn't forget this skill of waiting when you go live.
Ignored
I'm not familiar with that program, but I assume you test with Monopoly {fake} money?
My point was that demo trading does not have the same emotion as live trading for many people. Sure it may for some, but like I said some people can act and others (like myself) cannot.
There are many hurdles in a traders journey. A particular hurdle may be 10ft high for one person and only 2 inches high for another.
BEOB (or 3 day pin?) off of 365 EMA on EURUSD (failed pins previously highlighted on the 12th...think they were closer to neutral bars. funny how they look more like pins when you haven't traded in a week or two ) Excuse the messy fibs.
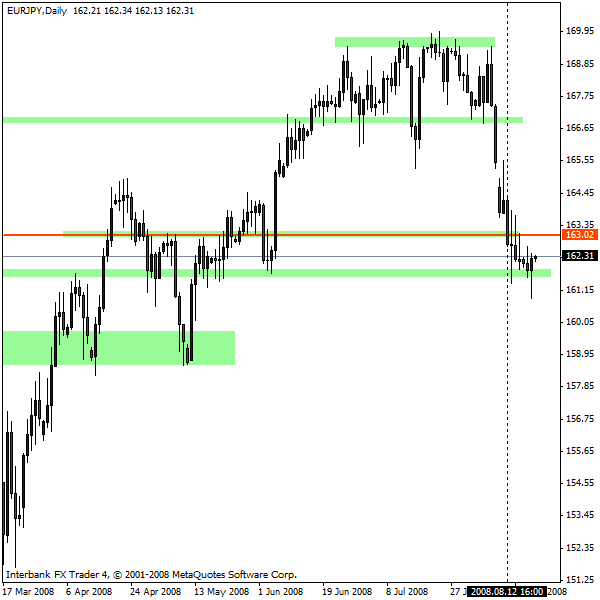
Pin off of support, 50% retrace of latest big move, and 365 EMA on EURJPY (failed pin previously, guess she wasn't ready just yet). Scared of it staying inside the pennant formation that formed over the past year though, marked by descending trend line.
Lots of stuff compressing into pennant formations over the last few days. If there are more pairs doing it than not, you would think maybe to stay out of the market. Guess that's what demo trading is for!
Joined Feb 2006
|
Status: 'Try-hard' extraordinaire...
|2,151 Posts
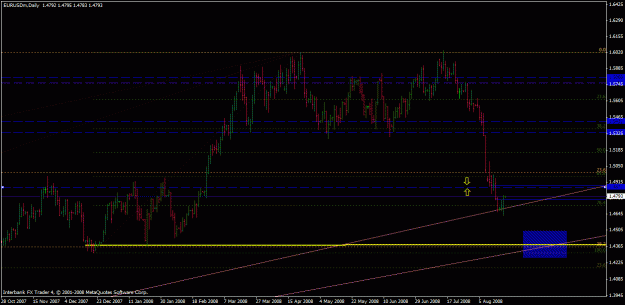
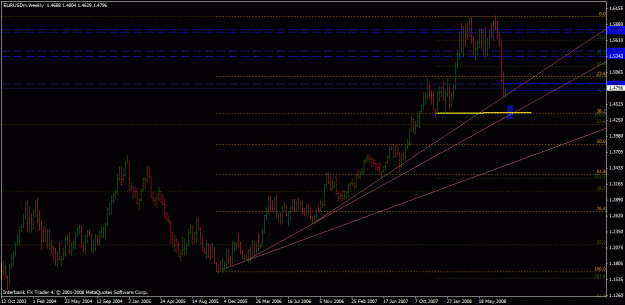
EURUSD Charts
First chart shows daily bars.
Current Outside bar is placed at OK confluence...
* Trendline (derived from 'close' priced line chart)
* 76.4% Fibonacci retracement. Drawn from December lows to recent highs.
This isn't a A+++ trade, of course.
I'm willing to take this one though. It's a 'cute' (lol @ Jaroo) outside bar against a trendline with some Fibonacci confirmation and a 1st target that is not way too close.
First target is 1.4872 area. (marked by yellow arrows) I'll cover my a... right here. Taking off two thirds of the position here this time around since it's not an ideal Risk/Reward ratio, but IS very likely to hit this first target. (I want strong cover for any remaining position. )
The fact that we have at least stalled for a few days makes it more likely to at least hit here. (if it doesn't, then... whatever ...who cares. It's less than 1% of my account. ) When we hit, I'll more than likely move the rest to break even.
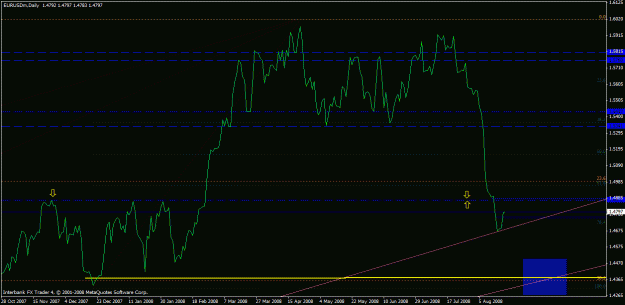
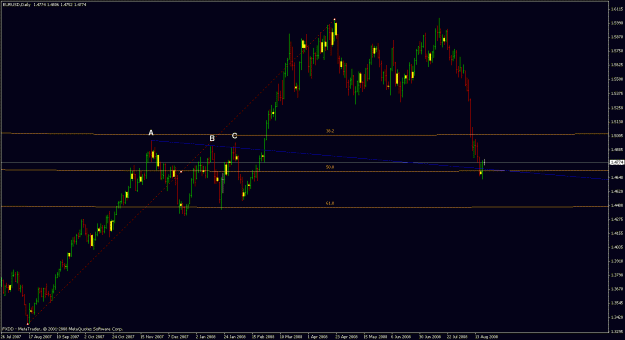
The second chart (line chart of close prices) shows how i've chosen this TP level by taking the first swing-high close of the consolidation area from late last year.
NOW....
....for my other little marked area. The potential A++ trade.
(Take note, not 3 pluses! )
The BEST trade is going to hit at around about that blue box or so. (
Look at all the events that line up.... (bewwaaaahahahaaa!!! )
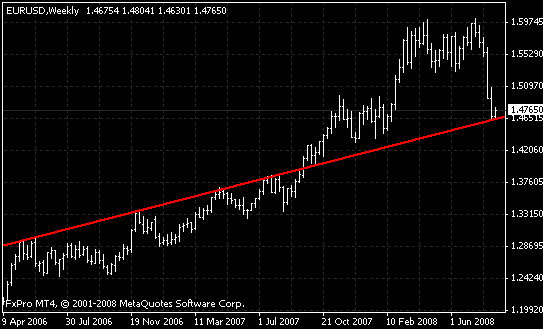
* TWO trendlines. ...One you can't see because it's just about spot on with the other. One is drawn from weekly chart using bar lows. The second is derived from the line chart. ...Satisfies two groups of thinking on this subject. ALWAYS good.
* 38.2% Fibonacci retracement drawn on weekly chart (Chart 3) and defined by late 2005 lows to recent highs. (There is ALMOST another fib from the monthly chart too, btw. It's too far out of reach and would have to destroy the integrity of all the others to be hit.)
* Yellow support line. Draw it from weekly line chart. Daily line chart. Daily lows.. or whatever, I don't care. They're ALL close enough to that Fib line.
There could be more. Got enough. Don't have to look at moving averages pivots etc.
If we get down to this level. This trade is going to be a no-brainer once we get PA confirmation. A guy could wait for these types of trades and be VERY successful. And they come along more often than you think.
Will we get there though? ...My gut feeling (which I don't trade) says it's a magnet that will be reached over the coming weeks.
If price doesn't have anything in it's path that would cause it to stop, it won't(like in physics).
Ignored
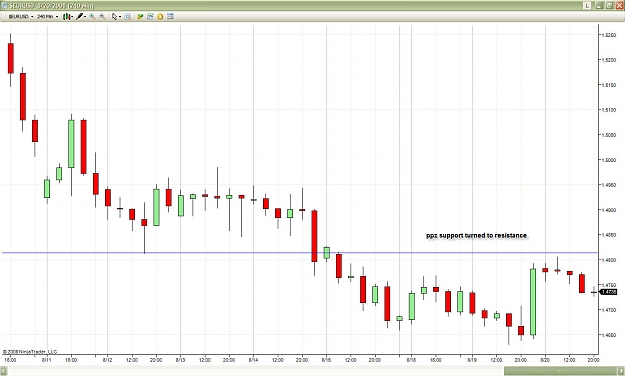
Thinking in terms of physics, let's say we're trying to break down a door (or the price is trying to break through PPZ).
Sprinting a 3 mile run up would be pointless as you'd be too tired by the time you reach the door and merely bounce off it. A more practical approach would be a 5-10 meter run up, enough time to build momentum with enough gas in the tank to burst through it.
Thinking in terms of physics, let's say we're trying to break down a door (or the price is trying to break through PPZ).
Taking a 3 mile run up would be pointless as you'd be too tired by the time you reach the door and merely bounce off it. A more practical approach would be a 5-10 meter run up, enough time to build momentum with enough gas in the tank to burst through it.
Ignored
yeah, pretty much, and with enough liquidity in the back bed.
thank you for sharing this detailed analysis with us ...
can i add to the confluence party?
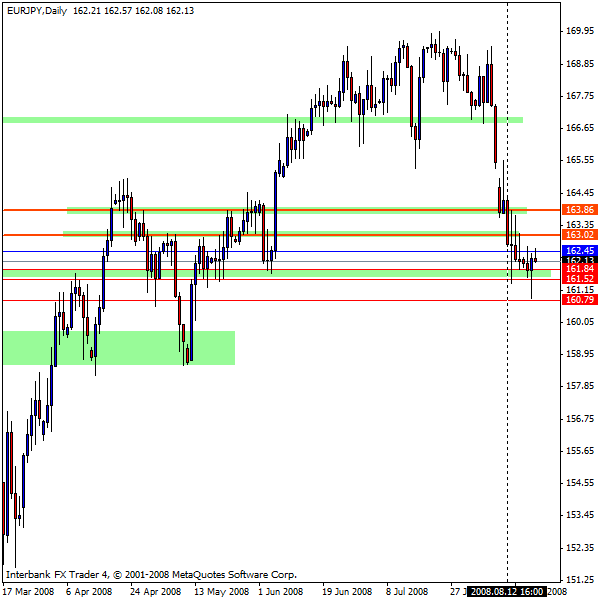
diagonal resistance becomes potential support ... (something i learnt reading pring) ... off 50% fib from aug 07 to jul 08 ... potential targets at "A" "B" "C" (horizonatal resistance).
Attached Image (click to enlarge)
"Believe nothing you hear and half of what you see." Proverb
Hi!
Would You tell me the purpose of Your blue (trend?)line?
I don t understand that. I tied your A and C point with a line not A-B.
THX, Laszlo
Ignored
oh crap! now you're going to make me think ...
basically, from what i now understand about trendlines, they are more than just something to identify a trend and don't have to be drawn only from lower, highs to lower, highs or vice versa. i didn't fully understand this until reading through pring's book (a recommended read by many in this thread ... including j16). trendlines can actually create diagonal support/resistance (versus just your run-of-the-mill horizontal support/resistance area) and price patterns have a tendency to bounce off these lines (hence, they have a way of generating their own type of "ppz"). so, ... where i have drawn the TL here, it shows a diagonal resistance where price has recently bounced from and given us this BUOB. the diagonal resistance shown might now give price some support to go up. as for this specific line, a line does not have to necessarily be drawn "to-the-pip" on a specific point. and in this case, i drew a line from A to B cutting through C (C is a point of "exhaustion" ... but that is a whole other concept i just don't think i could adequately explain).
i'm not sure if this is more confusing than helpful and perhaps a senior j16 trader can help clarify this concept for you more.
peace and good trading.
"Believe nothing you hear and half of what you see." Proverb
WOW . I totally missed that one. Should edit my charts eh? LOL
That actually makes it a lot more convincing.
Edit: Even before that, I was already happy with my original trend line. It was there before we hit this area.
Ignored
Bundy, great analysis. Although I was aware of all the "reasons" to take the EU long trade, the way you explained your thinking process enlightened me even further. Thanks and keep them coming.
All these talks about usd retracement against all pairs gave me the jitters. 3 nice PBs on 4HR I didn't take. I need to stop reading and watching all the media heads and just take the signal. And also one of the seniors here I think went long on gbp/usd on daily PB. That spook me too
Dammit, I need to remember that I'm trading on different TFs.
Oh well, lessons learned.
I not sure whether is it right to post about pin bar here, but thought since this thread is started by james16 so i think shld not be a problem. Pls let me know the correct place to ask abt pin bar though...
the picture show the nice long pin bar on 14 Aug, but as most of you might have notice, till now it is not even breakthrough the high of the pin, so after so many day is it still valid? (since it is also not break the low of the pin too...)
DHLC just occured on EUR/USD 15 min chart - still time to get in
downtrend continuation
price trading just under the central pivot
stochs overbought
Ignored
I would not trust a pattern on a 15min chart, but I would use a setup on a higher time frame then maybe look for a tighter entry on a 5/15min chart in the direction of that higher time frame setup...