Hi C12,
Would you mind explain what is the logic behind your trades?
Do you look monthly, weekly, daily to spot some valid levels?
And when you spot this levels what kind of PA do you look? BEOB, BUOB, engulfs of last swings and retrace? and what TFs do you use to look for PA as a trigger?
Could you post some charts to explain all your logic behind TFs?
Hi C12, Would you mind explain what is the logic behind your trades? Do you look monthly, weekly, daily to spot some valid levels? And when you spot this levels what kind of PA do you look? BEOB, BUOB, engulfs of last swings and retrace? and what TFs do you use to look for PA as a trigger? Could you post some charts to explain all your logic behind TFs? Thank you very much
Ignored
Yeah definitely.. I'll need to spend some time and will write this up.
Hi C12, Would you mind explain what is the logic behind your trades? Do you look monthly, weekly, daily to spot some valid levels? And when you spot this levels what kind of PA do you look? BEOB, BUOB, engulfs of last swings and retrace? and what TFs do you use to look for PA as a trigger? Could you post some charts to explain all your logic behind TFs? Thank you very much
Ignored
Ok
The main thing is supply and demand levels and PA (not necessarily perfect textbook BEOBs or PIN bar's etc). Mainly an engulfing formation or pullbacks at nice fresh zones. If these zones are with the trend then even better.
So you start by analysing weekly and daily for each time frame, then drop down to H4 and H1 (You want to be asking yourself - where are the zones, what is the trend?). The higher time frame action will always rule but you can then spot familiar set-ups on any time frame.
Question - Can you spot on the Weekly / Daily why I bought USDCAD today?
{quote} Ok The main thing is supply and demand levels and PA (not necessarily perfect textbook BEOBs or PIN bar's etc). Mainly an engulfing formation or pullbacks at nice fresh zones. If these zones are with the trend then even better. So you start by analysing weekly and daily for each time frame, then drop down to H4 and H1 (You want to be asking yourself - where are the zones, what is the trend?). The higher time frame action will always rule but you can then spot familiar set-ups on any time frame. Question - Can you spot on the Weekly / Daily...
Ignored
Just for you know, i sold exactly on H4 supply (that i will show on the images below) thinking that we still was on a down trend.
But after you show me this picture, i think i can see what you said.
Let me explain what i see
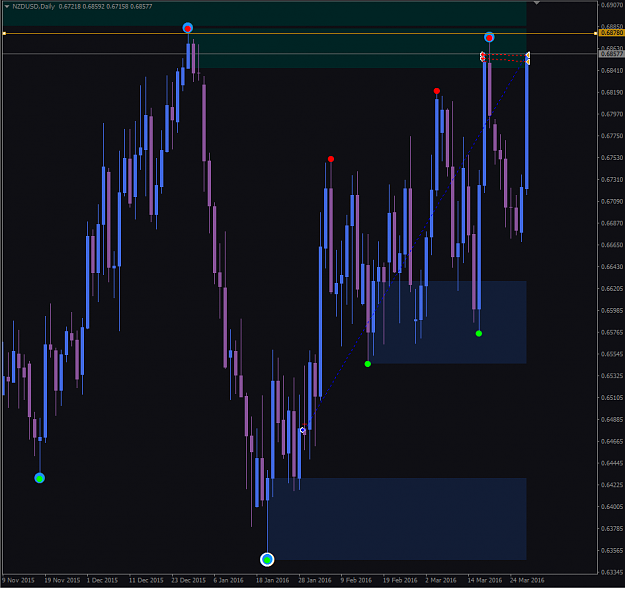
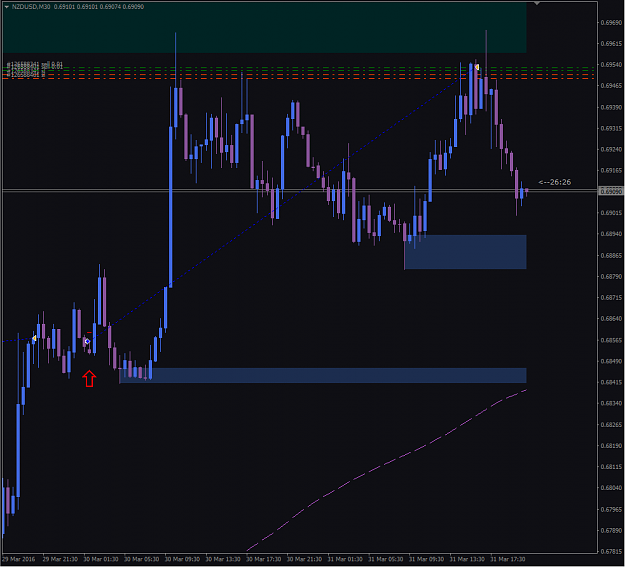
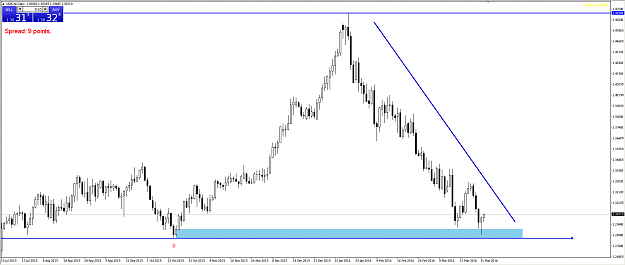
On weekly a good S/R on the lower blue line and a good demand (indicated with the red arrow up) holding the move up
Attached Image (click to enlarge)
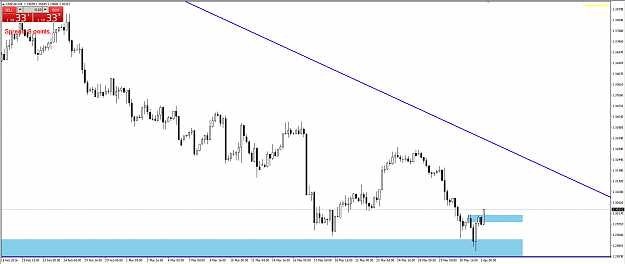
On daily this demand is more clear, and the next to last daily candle show a rejection, proving that the demand is still holding.
But, with this trend line we can see that we are on a down trend for a loong period
Attached Image (click to enlarge)
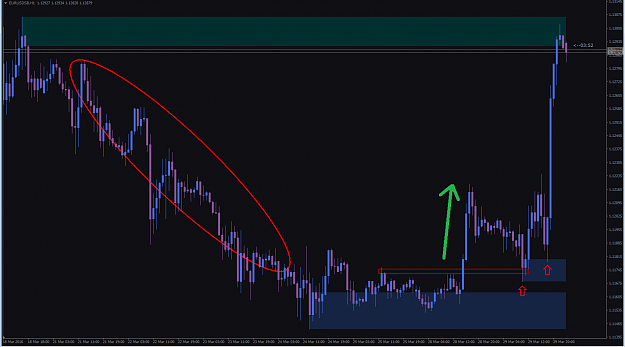
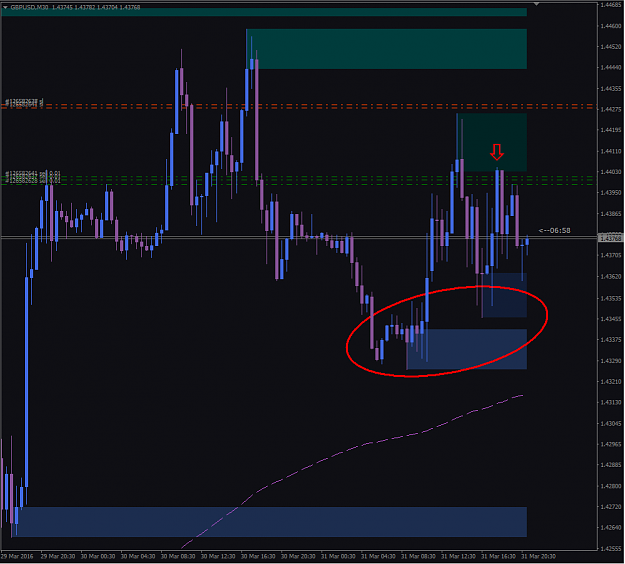
On 4H we can see a nice bullish engulfing candle but right above this candle (on the upper rectangle) we can see the last supply and as we was on a down trend and it was still not engulfed, i thought that was a good idea to sell it.
But on the other hand we can see a strong bullish move up and that was what you saw and i not, for me this was a retrace to the supply.
Attached Image (click to enlarge)
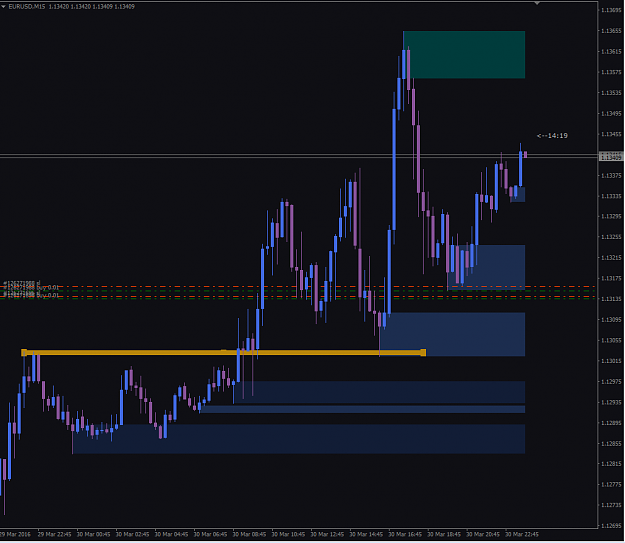
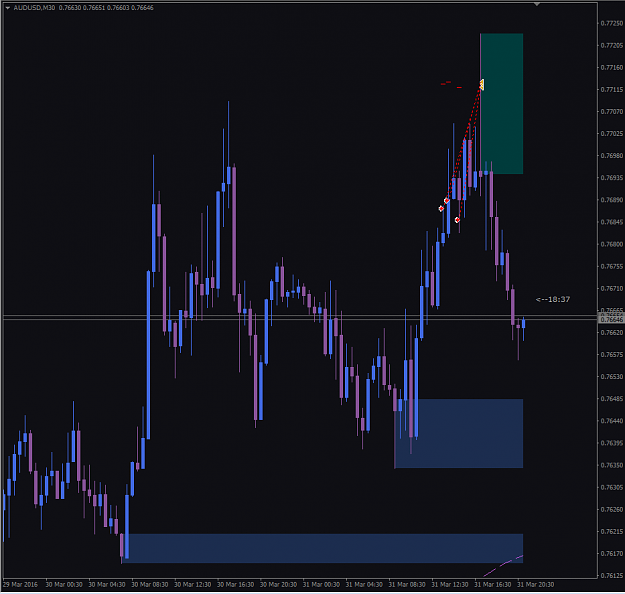
On M15 the last supply/flag (indicated but the lower horizontal line) was strong engulfed by the bullish move so you bought and you was right, the upper supply not held the move down.
{quote} Just for you know, i sold exactly on H4 supply (that i will show on the images below) thinking that we still was on a down trend. But after you show me this picture, i think i can see what you said. Let me explain what i see On weekly a good S/R on the lower blue line and a good demand (indicated with the red arrow up) holding the move up {image} On daily this demand is more clear, and the next to last daily candle show a rejection, proving that the demand is still holding. But, with this trend line we can see that we are on a down trend...
Ignored
Awesome stuff. If you do this analysis prior to all trades you will do very well.
My lower buy was a single play on the Daily demand level holding. I was watching M15 and it turned out to be a pretty good entry with bullish momentum behind it at the time of entry. Should have added more looking back.
The upper add ons were based on the retrace to the M15 zone on the back of strong momentum off a 120+ pip H4 engulfing candle. Very low risk entries. I could have been wrong but the R/R potential looked good.
I have no idea what NFP will bring later and that daily demand could get sliced later. Will be an interesting day.