Dislikedlooking good, but i have another suggestion:
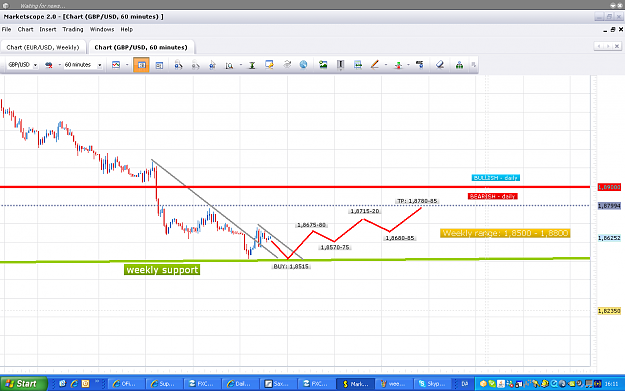
what we have on the weekly cable chart is a complex h/s formation with a broken neckline. a MAJOR change of trend which i believe will reach 1.72x before the end of the year
i had expected 2 weeks ago that we might bounce off 1.90x area, but we didnt, which displays the strength of the trend reversal.
welcome to the era of dollar strength fellas
AttachmentIgnored
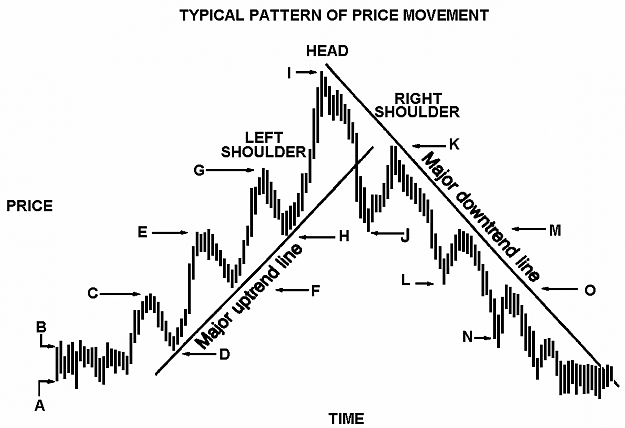
here's something by the book... plz try to compare this with cable's weekly chart
Attached Image (click to enlarge)