1 ) look to 15 min chart for trend direction ... sometimes can be sideways or trending
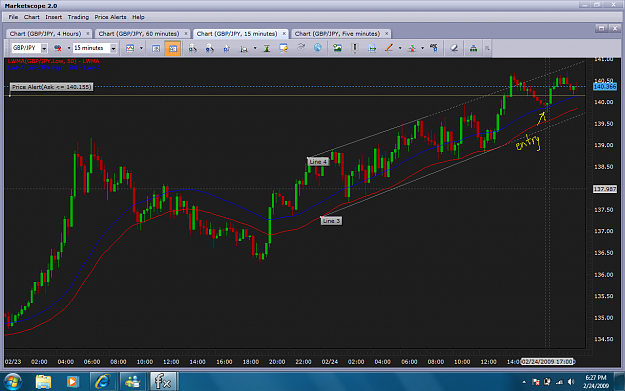
2) look for set ups ... for example if the 15 min is trending strongly and you are unsure of going against trend wait for pull backs on a 5 min . If the price slips under a daily fib pivot level and then say a reversal candle pattern forms ( like an engulfing candle as per attached chart) .. then take the long . Keep the stops tight and let the winners run. Even with a 40 % success rate this is a money maker.
The blue line in that attached chart are the dialy fib pivots i was trading around today ..
if you like stochastics .... then place these on the chart ... get a buy or sell signal on stochastics near a fib pivot then trade....
i use rsx ... that is my indicator .. any indicator will work
The indicator is seondary .. the price action is what i watch to determine if I trade ( candle patterns , volume etc )
Attached Image (click to enlarge)
Blogging daily now at www.volume.zone