I meant my last post to start with a quote from Bfriend
Ignored
I use MT4 for the charts, but I use my broker's software (MBT Navigator) to actually place orders. It's kind of redundant since you can place orders through MT4, but I have MT4 on 1 screen and my broker on another screen so it's just as easy.
Out of all of those arrows, 6 out of 7 looks like false indicators, or am I wrong?
And on the last one, the lags don't look like they should be when you would normally buy.
Ignored
actually 5 where false ( however they did cross) false in the maenig of trades. as stated before, choppy market, more signals you can draw trend lines support resistance.
The first on the left was a sell signal from an very good trade but the chart was to large for the picture.
For a laguerre setup was the last alert not ideal.
this picture is better and laguerre is in application. A huge sell
I use MT4 for the charts, but I use my broker's software (MBT Navigator) to actually place orders. It's kind of redundant since you can place orders through MT4, but I have MT4 on 1 screen and my broker on another screen so it's just as easy.
However, they do take a $1 comission per mini lot (basically 1 pip) on both ends.
So if the spread is 2 pips, it's more like 4 pips after comission. Still not bad at all. They have 1 pip spreads for almost everything else.
Ignored
Alot better than a 7 pips spread. I am really considering changing my broker . I would ask you many other things but I dont want to get off this thread topic.
Thank you for yur response ...
Happy trading !
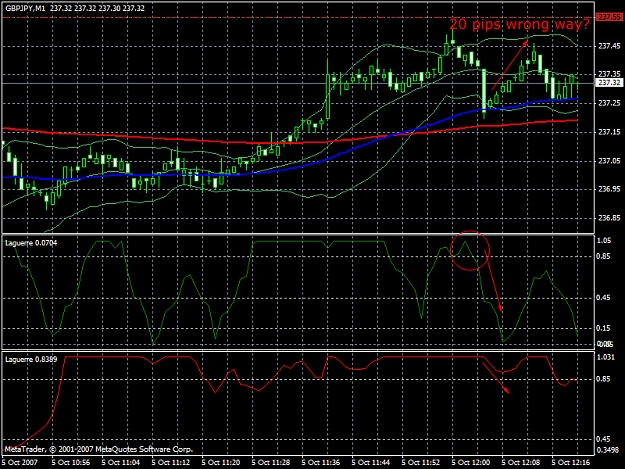
Can you take a look at this chart? I didn't act on this, but could this be a false sell indication? I RARELY see a false indicator with your lag setup, but isn't this a valid sell?
While I'm sure this will EVENTUALLY go in the downward direction, if you put in a sell order based on that indicator with a 15 pip s/l you would have been stopped out in 5 minutes without it ever moving 1 pip in the right direction.
I still have faith in the lags -- I know nothing is perfect -- but that kind of scared me.
The only reason I didn't trade that was because lag 1 wasn't pinned at the top (horizontal at top) before coming down below 0.85. Should that be a requirement? If so, this wasn't really a false indicator, but I wasn't sure.
Alot better than a 7 pips spread. I am really considering changing my broker . I would ask you many other things but I dont want to get off this thread topic.
Thank you for yur response ...
Happy trading !
Out of all of those arrows, 6 out of 7 looks like false indicators, or am I wrong?
And on the last one, the lags don't look like they should be when you would normally buy.
Ignored
technically, it was a tough call, but as the red lag was climbing , that trade would have been safe. Only if the red lag is at the top and going flat, that would have not been a good idea, if doing for scalping 3-8 pips then its ok to take that last one
Can you take a look at this chart? I didn't act on this, but could this be a false sell indication? I RARELY see a false indicator with your lag setup, but isn't this a valid sell?
While I'm sure this will EVENTUALLY go in the downward direction, if you put in a sell order based on that indicator with a 15 pip s/l you would have been stopped out in 5 minutes without it ever moving 1 pip in the right direction.
I still have faith in the lags -- I know nothing is perfect -- but that kind of scared me.
The only reason I didn't trade that was because lag 1 wasn't pinned at the top (horizontal at top) before coming down below 0.85. Should that be a requirement? If so, this wasn't really a false indicator, but I wasn't sure.
Ignored
that would have been a very good trade if u had taken it, as long as the blue lag is moving down and the red lag is also at the top...then it can be a trade but if the red lag also follows down then it will be the icing in the cake, can expect 30-50 pips movement if both red and blue lag are below 0.85
that would have been a very good trade if u had taken it, as long as the blue lag is moving down and the red lag is also at the top...then it can be a trade but if the red lag also follows down then it will be the icing in the cake, can expect 30-50 pips movement if both red and blue lag are below 0.85
Ignored
Uhh, if I had taken that trade I would have immediately hit my stop loss and lost 15 pips. How would that have been good? Didn't you see the chart? Even now, an hour later, it still hasn't moved in a negative direction after that indication.
I'm kind of confused by your response.
I understand that normally yo ucould expect 30-50 pips movement, but in that particular instance that didn't happen and still hasn't.
Here's another question that might help some other people.
Look at the very end of the first chart. Is this a valid SELL signal or does the red lag need to be above .45 when pointing down?
I didn't take this trade because I assumed it had to be above .45 and pointing down (ideally coming down past .85 from the top).
Then, look at the 2nd chart, just a few minutes later. Is this a valid BUY signal? It sure looked like it to me, but I wasn't sure. I was going to take it but figured I'd ask fist. (This ended up being an easy 11 pips in 4 mins that I didn't take...oh well )
Uhh, if I had taken that trade I would have immediately hit my stop loss and lost 15 pips. How would that have been good? Didn't you see the chart? Even now, an hour later, it still hasn't moved in a negative direction after that indication.
I'm kind of confused by your response.
I understand that normally yo ucould expect 30-50 pips movement, but in that particular instance that didn't happen and still hasn't.
Ignored
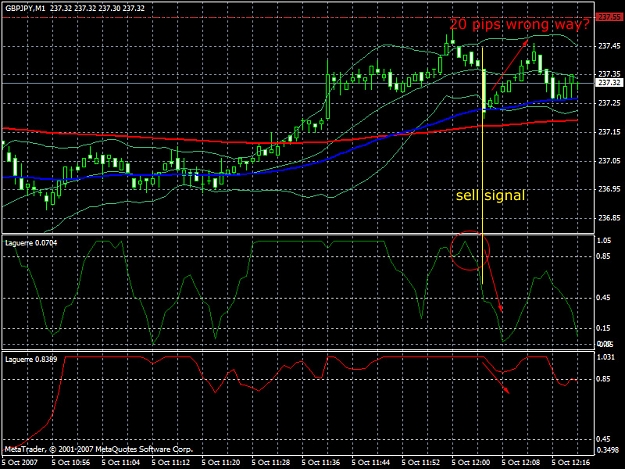
as per the chart, ur entry would have been around 237.40 area, am i right, and since its a big day today...the movements are very slow..that may be the reason it has not fallen yet, its ranging between 237.10 and 237.50, we will see a breakout today after NFP news
Here's another question that might help some other people.
Look at the very end of the first chart. Is this a valid SELL signal or does the red lag need to be above .45 when pointing down?
I didn't take this trade because I assumed it had to be above .45 and pointing down (ideally coming down past .85 from the top).
Then, look at the 2nd chart, just a few minutes later. Is this a valid BUY signal? It sure looked like it to me, but I wasn't sure. I was going to take it but figured I'd ask fist. (This ended up being an easy 11 pips in 4 mins that I didn't take...oh well )
Ignored
the second chart is much better to use as the first is not right to enter a trade
also see the bounce of price on the 200 ema, it is another indication that buyers are in control of market at present
right now, market is ranging...so enter and exit markets even with 5-10 pips profit..dont hold for long
as per the chart, ur entry would have been around 237.40 area, am i right, and since its a big day today...the movements are very slow..that may be the reason it has not fallen yet, its ranging between 237.10 and 237.50, we will see a breakout today after NFP news
Ignored
If you look at the chart again, my entry wouldn't have been at 237.40. The sell signal came at about 237.25, then 5 minutes later it went up to 237.48, which would have triggered my S/L.
I've marked up my chart even more to further illustrate this.
Technically, if I had a 0 second reaction time, yes, I could have gotten in much higher. But in reality, just about 30 seconds after the lag 1 broke 0.85 the price was at 237.25 or so.
So I gues technically this isn't a false signal then after looking at it closer...but at the time of that huge downward candle the lag was still drawing / repainting. It wasn't until after that candle that it was a CLEAR sell signal, at which point, I would have been screwed if I got in. Very tricky...
Ignored
yes, in this choppy market, and specially today..i would rather sit back and study the chart movements and do paper trade..and save my capital.coz no indicator will work today....its going to get haywire