GDX Elliott Wave Analysis: Calling The Reaction Higher From Inflection Area
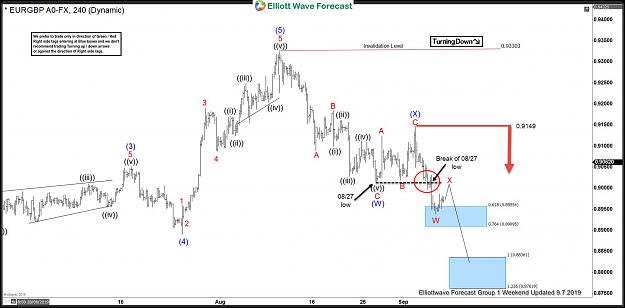
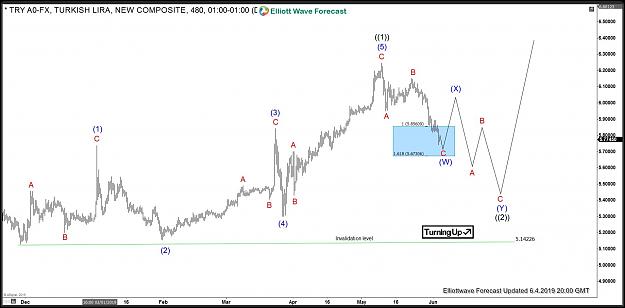
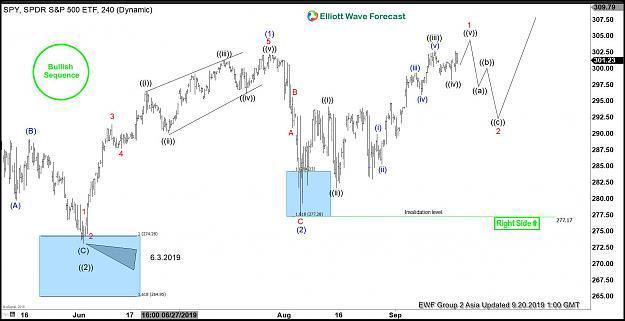
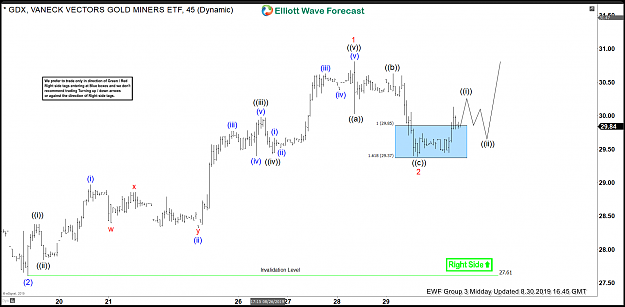
Hello fellow traders. Today, I want to share some Elliott Wave charts of the GDX which we presented to our members in the past. You see the 1-hour updated chart presented to our clients on the 08/30/19. showing that GDX ended the cycle from 08/18/19 low at the peak of 08/28/19 at 30.88.
Below from there, we advised members that the pullback should extend lower into the blue box. Below 30.88 level, we said to our clients it should see the equal legs from 08/28 peak towards the areas of the 100 – 1.618 Fibonacci extension of the black wave ((a))-((b)) which came around 27.85-29.37. Therefore, we expected buyers to appear in the sequences of 3, 7 or 11 swings. And that was the first area for buyers to appear to take prices to new highs.
GDX 08.30.2019 1 Hour Chart Elliott Wave Analysis
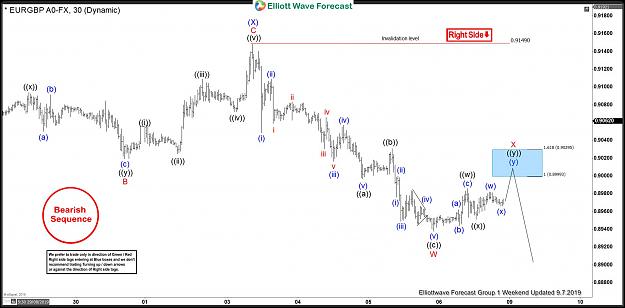
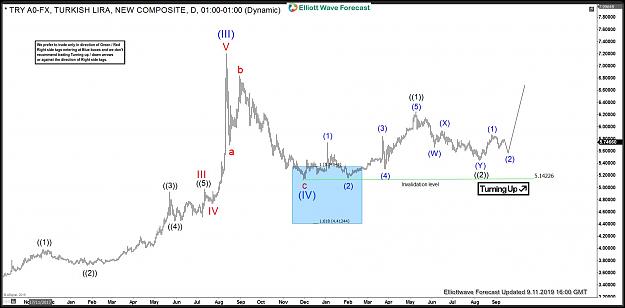
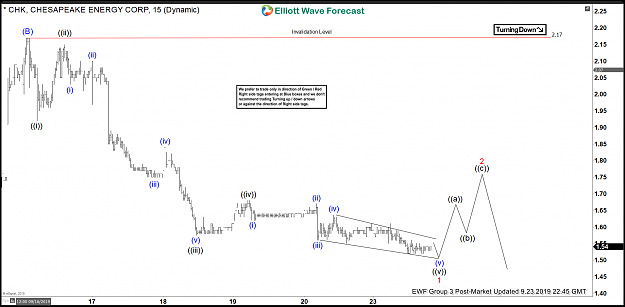
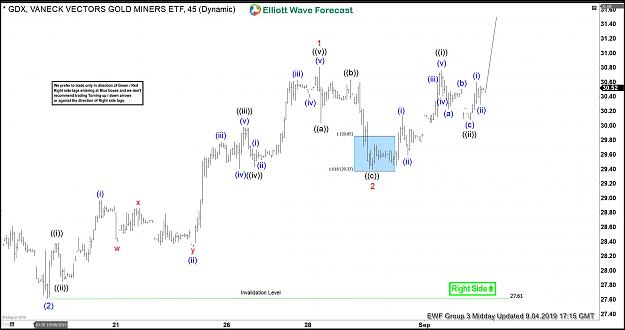
In the last Elliott Wave chart, you can see that GDX reacted nicely higher and continued the rally. Due to the right side up tag, we expected GDX to be supported overall. Any trades from that area have been risk-free, which means the stop-loss was moved to breakeven, targeting higher levels. Do please keep in mind that the 1-hour chart which I presented might have changed already. The blue boxes you see in our charts are our so-called High-Frequency boxes. Where the market ideally shows us a reaction either lower or higher. These areas are used be traded in the direction of the right side.
If you are interested in how to trade our blue box areas and want to understand how Elliott Wave works. Then I recommend you to get a shot on our 14 days free trial below. We present a lot of trading setups in our 3 Live Trading Rooms.
GDX 09.4.2019 1 Hour Chart Elliott Wave Analysis
I hope you liked this blog and I wish you all good trades. And for all who are interested in learning more about our unique blue box areas and also want to trade profitably in 2019 then sign up for a free 14 days trial you can cancel anytime. Click the link and see you insight
Hello fellow traders. Today, I want to share some Elliott Wave charts of the GDX which we presented to our members in the past. You see the 1-hour updated chart presented to our clients on the 08/30/19. showing that GDX ended the cycle from 08/18/19 low at the peak of 08/28/19 at 30.88.
Below from there, we advised members that the pullback should extend lower into the blue box. Below 30.88 level, we said to our clients it should see the equal legs from 08/28 peak towards the areas of the 100 – 1.618 Fibonacci extension of the black wave ((a))-((b)) which came around 27.85-29.37. Therefore, we expected buyers to appear in the sequences of 3, 7 or 11 swings. And that was the first area for buyers to appear to take prices to new highs.
GDX 08.30.2019 1 Hour Chart Elliott Wave Analysis
Attached Image (click to enlarge)
In the last Elliott Wave chart, you can see that GDX reacted nicely higher and continued the rally. Due to the right side up tag, we expected GDX to be supported overall. Any trades from that area have been risk-free, which means the stop-loss was moved to breakeven, targeting higher levels. Do please keep in mind that the 1-hour chart which I presented might have changed already. The blue boxes you see in our charts are our so-called High-Frequency boxes. Where the market ideally shows us a reaction either lower or higher. These areas are used be traded in the direction of the right side.
If you are interested in how to trade our blue box areas and want to understand how Elliott Wave works. Then I recommend you to get a shot on our 14 days free trial below. We present a lot of trading setups in our 3 Live Trading Rooms.
GDX 09.4.2019 1 Hour Chart Elliott Wave Analysis
Attached Image (click to enlarge)
I hope you liked this blog and I wish you all good trades. And for all who are interested in learning more about our unique blue box areas and also want to trade profitably in 2019 then sign up for a free 14 days trial you can cancel anytime. Click the link and see you insight