Just adjusted this after the euro fundys,
Trading Plan EurJpy 02 Jan 2019
ECONOMIC NEWS - High, Spain, Swiss -Medium USA - Mkt Manufacturing
DAILY - Reference for support and resistance only
ROMAR, EMA, PSAR - Resistance
LAST DB/SAR - Both bottom attachment at 124.394 passed thru 0 on Fibs
LAST EMA ARROW - Down
LAST MAC D - Down
FIBO - Green
BOLLINGER BANDS - Spread wide open
NOTES
Romar EMA Psar show down trend, 4 horsemen heading downwards, DB/SAR bottom attachment showing divergence
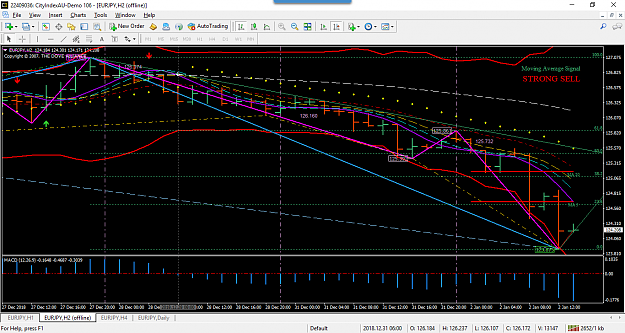
4HR - Reference for support and resistance only
ROMAR, EMA, PSAR - Resistance
LAST DB/SAR - DB SAR Bottom Attachment 124.394 on zero fib line
LAST EMA ARROW - Down
LAST MAC D - Down
FIBO - Green
BOLLINGER BANDS - Spread wide open
NOTES Romar EMA Psar show down trend, 4 horsemen heading downwards, DB/SAR bottom attachment showing divergence
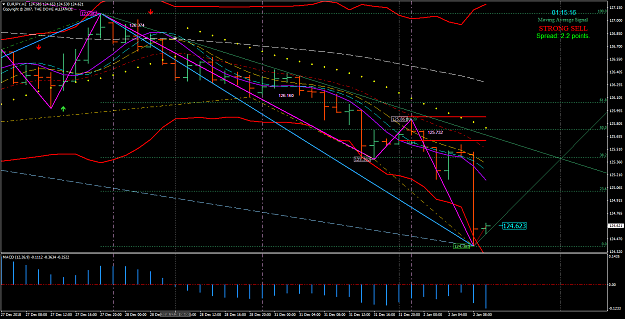
2HR – Trading Chart
ROMAR, EMA, PSAR - Resistance
LAST DB/SAR - DB SAR Bottom Attachment 124.394 on zero fib line
LAST EMA ARROW - Down
LAST MAC D - Down
FIBO - Green
BOLLINGER BANDS - spread wide open
NOTES
Trend is down, 4 Horsemen down High Euro news bumped mkt down below zero to 124.392
1HR – Reference for support and resistance only
ROMAR, EMA, PSAR - Resistance
LAST EMA ARROW - Down
LAST MAC D - Down
FIBO - Green
BOLLINGER BANDS - Spread Wide Open
NOTES
4 Horsemen down but purple is meeting white looking to cross for up
SUMMARY NOTES
Trend is down but well passed the zero on all fibs. All 4 charts are in sync, Definate room for buy with DB & SAR divergence at zero line. Waiting for confirmation of purple crossing White and Smooth & EMA, Psar to flip n MacD to cross up on 2hr chart.
Question is has the down trend been exhausted? MacD on daily is not indicating that it has yet.
ENTRY - IS ON NEW H2 BAR once summary signals have occurred. Sitting on hands being patient now.
RULES
· "Be Vigilant of all charts. See everything in the moment as a whole unit'
· Are all 4 charts IN SYNC?
· Is 1hr in sync with 2hr? If so you have a trend, if not you are in consolidation.
· when both the DB and SAR is running together as one unit then the market is ranging. The ranging will end when the SAR breaks loose.
· Daily will give reference of support & resistance within the Daily The Daily ROMAR is the key when the market will turn direction. Once it crosses Purple the game is over and time to be looking at the opposite direction for long term. ROMAR is also both Support and Resistance on all three charts.
· EMA is your trend indicator with Purple for the swings. EMA below Purple the trend is up in the swings. EMA above Purple the trend is down in the swings.
· Signal for a parabolic flip is when the Parabolic is at EMA for the Purple crossing.
Trading Plan EurJpy 02 Jan 2019
ECONOMIC NEWS - High, Spain, Swiss -Medium USA - Mkt Manufacturing
DAILY - Reference for support and resistance only
ROMAR, EMA, PSAR - Resistance
LAST DB/SAR - Both bottom attachment at 124.394 passed thru 0 on Fibs
LAST EMA ARROW - Down
LAST MAC D - Down
FIBO - Green
BOLLINGER BANDS - Spread wide open
NOTES
Romar EMA Psar show down trend, 4 horsemen heading downwards, DB/SAR bottom attachment showing divergence
4HR - Reference for support and resistance only
ROMAR, EMA, PSAR - Resistance
LAST DB/SAR - DB SAR Bottom Attachment 124.394 on zero fib line
LAST EMA ARROW - Down
LAST MAC D - Down
FIBO - Green
BOLLINGER BANDS - Spread wide open
NOTES Romar EMA Psar show down trend, 4 horsemen heading downwards, DB/SAR bottom attachment showing divergence
2HR – Trading Chart
ROMAR, EMA, PSAR - Resistance
LAST DB/SAR - DB SAR Bottom Attachment 124.394 on zero fib line
LAST EMA ARROW - Down
LAST MAC D - Down
FIBO - Green
BOLLINGER BANDS - spread wide open
NOTES
Trend is down, 4 Horsemen down High Euro news bumped mkt down below zero to 124.392
1HR – Reference for support and resistance only
ROMAR, EMA, PSAR - Resistance
LAST EMA ARROW - Down
LAST MAC D - Down
FIBO - Green
BOLLINGER BANDS - Spread Wide Open
NOTES
4 Horsemen down but purple is meeting white looking to cross for up
SUMMARY NOTES
Trend is down but well passed the zero on all fibs. All 4 charts are in sync, Definate room for buy with DB & SAR divergence at zero line. Waiting for confirmation of purple crossing White and Smooth & EMA, Psar to flip n MacD to cross up on 2hr chart.
Question is has the down trend been exhausted? MacD on daily is not indicating that it has yet.
ENTRY - IS ON NEW H2 BAR once summary signals have occurred. Sitting on hands being patient now.
RULES
· "Be Vigilant of all charts. See everything in the moment as a whole unit'
· Are all 4 charts IN SYNC?
· Is 1hr in sync with 2hr? If so you have a trend, if not you are in consolidation.
· when both the DB and SAR is running together as one unit then the market is ranging. The ranging will end when the SAR breaks loose.
· Daily will give reference of support & resistance within the Daily The Daily ROMAR is the key when the market will turn direction. Once it crosses Purple the game is over and time to be looking at the opposite direction for long term. ROMAR is also both Support and Resistance on all three charts.
· EMA is your trend indicator with Purple for the swings. EMA below Purple the trend is up in the swings. EMA above Purple the trend is down in the swings.
· Signal for a parabolic flip is when the Parabolic is at EMA for the Purple crossing.
Attached Image (click to enlarge)