I have made the following notes for myself as a summary. Thought I would share as my contribution. Let me know if anything needs to be added / changed.
Guidelines for high probability Trades
Follow these GUIDELINES for high probability trades. These are guidelines and therefore not hard and fast rules. You can trade outside of them however you will face a lower probability of a successful trade. Price action is always key and something that is learnt through chart time and practice.
1. Times
- Best times to trade are 5 to 10 min after the opening of Tokyo, London and NY markets and then for the following 1 to 2 hours. (Note that lately momentum is coming in 30 to 45min after Sydney opening)
- The wait is to see if the market confirms the current currency strengths.
- Possible to trade outside of these times however probability, volatility and momentum decreases.
- Dont trade 30min before News
2. Pairs
- 13 Pairs (EU, GU, AU, CHFU, NU, UCAD, UJ, EJ, GJ, AJ, NJ, CADJ, CHFJ)
- Best when the following currencies are paired on the CM Strength Meter:
i. GBP & EUR
ii. USD& JPY
iii. AUD & NZD
- Best to trade the relevant currencies during times that correspond to their markets:
i. Toyko JPY, AUD and NZD
ii. London GBP, EUR, CHF
iii. NY USD, CAD
- Some pairs are essentially duplicates (e.g. EJ and CHFJ will behave very similarly) so be careful opening multiple trades at the same time as you will be risking 4% instead of 2% of your account.
3. Indicators
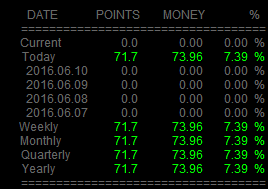
- CM Strength
i. Trade pairs strongest vs weakest of the 13 trading pairs during their market hours. The greater the difference the higher the probability. e.g. 8x1 is better than 6x2.
ii. Lines should be trending away from each other i.e. The strong currency trending upwards and the weak downwards.
iii. Arrows are pointing in the correct directions i.e. Strong currency is pointing up and weak down.
- RmUP / RmDwn Dont buy if RmUp is Red and dont short if RmDwn is Red
- Last MCandles and Price to Open must both be all Red for short or All Green for long.
4. Price Action
- Previous candle should be Red / Green for Short / Long respectively.
- Check ATR for average candle size , if candle is far bigger than average there is the potential for a pullback i.e. avoid trading on wide range bars.
- Avoid trades near to pivot points (S/R lines, pivots, natural S/ R areas like 100, 50s) (I changed the Sublevels setting on the SweetSpotsGold indictor from 5 to 50 to neaten up the charts)
- Short only if price is below the daily open and visa versa (however this is already covered by the Price to Open Indi)
- Best to trade long above the 34ma and short below (not an original rule but good to follow)
5. Entry
- When the above conditions are fulfilled you can either:
i. wait for the close of the current candle to enter for additional confirmation
ii. enter on the current candle
iii. place a buy / sell order at the 50/100 levels
I would suggest the following process when entering a trade:
- Note news releases and times for the day.
- Look at the Strength Meter and find strongest vs weakest pairs, also note if the currency pairs are in sync or out and if they correspond to their markets trading times. Related pairs are also trending together (U and J, E and G, A and N)
- If all good then go to the chart with the strongest vs weakest of our trading pairs
- Check the Indicator conditions are fulfilled
- Check previous candle size, colour,
- Check price action and S/R levels
- Pull the trigger
- Profit
Remember to be patient and wait for the best setups. You should have 2 to 3 each session.
Last note: It is also good the check what the main/primary currency pair is doing for the currency you wish to trade. E.g You are looking to short GJ, have a look at the GU chart. If GU is coming down to a major S/R level and USD is strong or average on the strength meter you can expect a bounce off the S/R. The probability that GJ will also experience a pullback is high.
Note: Please ignore the VBS and the Volume indicators in the attachment. I use them in conjunction with price action and they are not part of the original strategy.
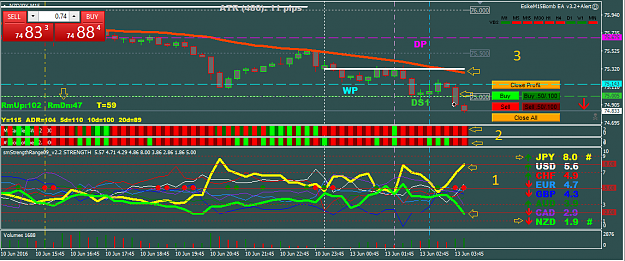
From the process above
#1 -
- NJ weakest vs strongest pair, arrows are green and red,
- Strength lines trending away from each other.
- Its during the Toyko session so ok to trade NJ.
- No news.
- Look to go short
#2 -
- Both indicators (previous and current) are Red, therefore confirms our Short bias
#3
- Below the daily open and M34
- RmDn is green
- Price Action- Previous candle is red, broken through and closed below the daily support line from a previous pull back from that support line, trending downwards, previous candle not a wide range bar (therefore ATR is ok)
All conditions are satisfied for a maximum probability trade. I entered the trade at the opening of the last candle. Trade was a winner with max 23 pips on offer.