USDCAD Weekly Technical Outlook
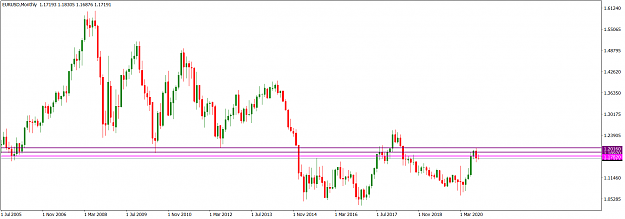
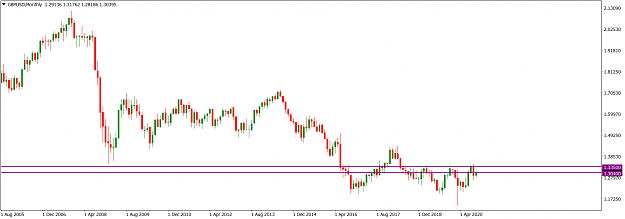
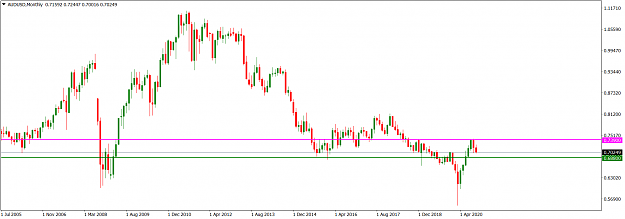
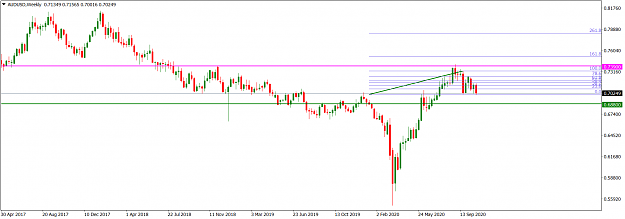
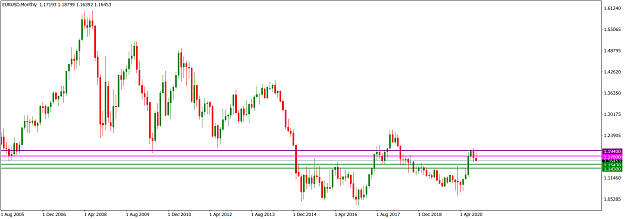
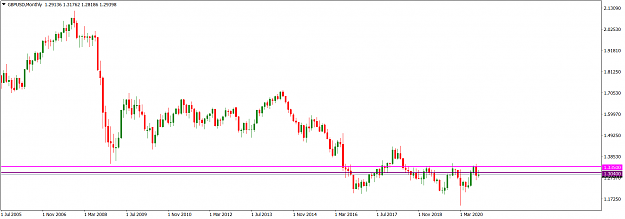
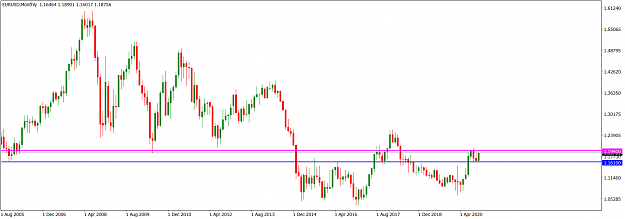
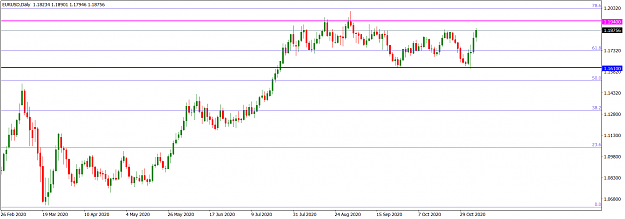
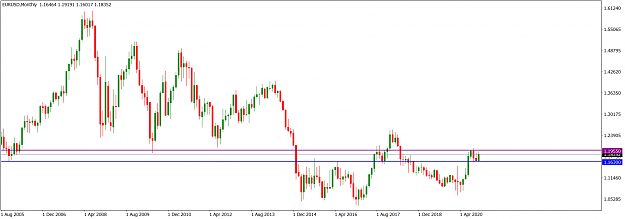
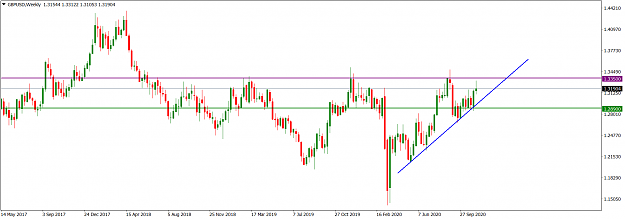
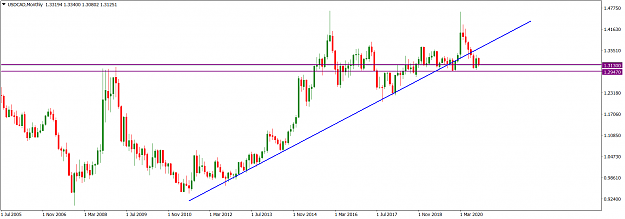
USDCAD market operation is at the 1.31300/1.29470 zone (purple) that has held as horizontal support since October 2018 after breaking below a rising trendline (blue) traceable to October 2012 in July.
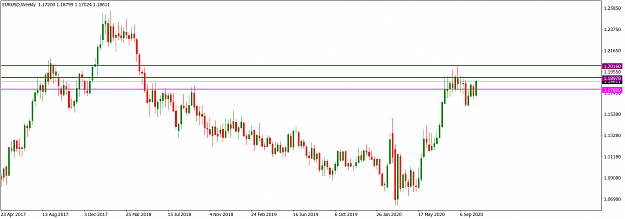
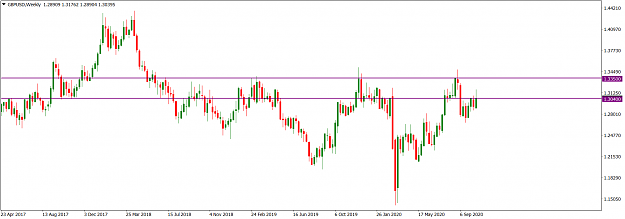
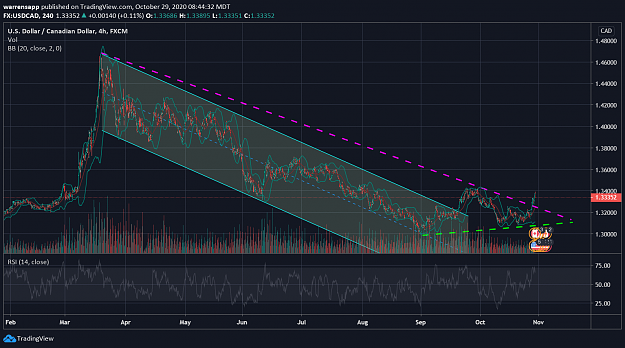
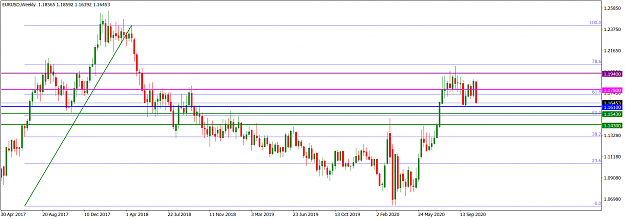
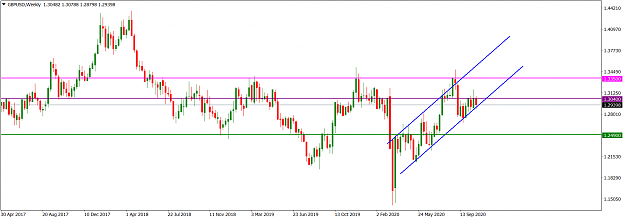
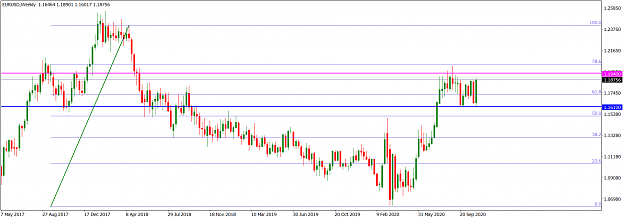
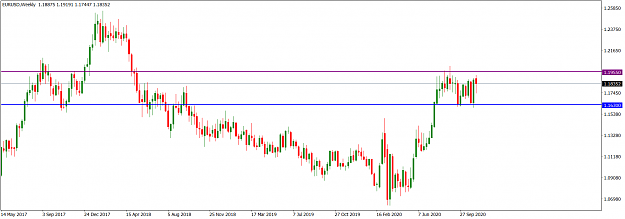
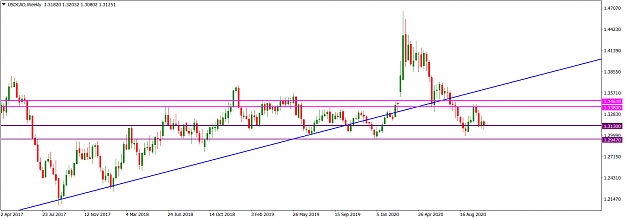
Market operation on the weekly time frame is bearing southward after retesting a previous horizontal support zone around 1.34630/1.33800 (magenta) for a role flip. After a relatively big bearish candlestick was printed three weeks ago, the last two weeks have produced two opposing candlesticks for a sideways of market operation as it gets near to the 1.31300/1.29470 multi-year horizontal support zone (purple). However, the order flow context favours bears and, technically, we may see a southward continuation this week.
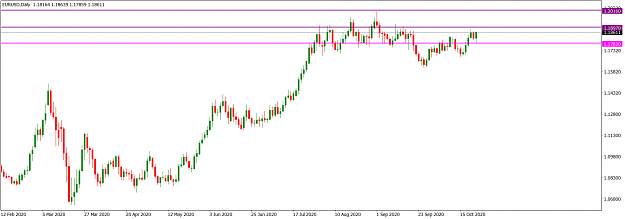
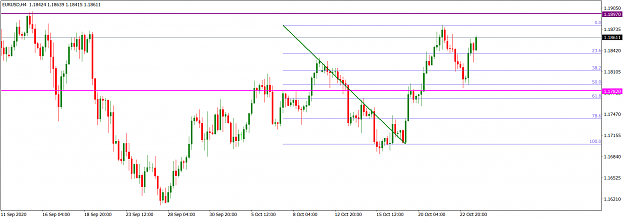
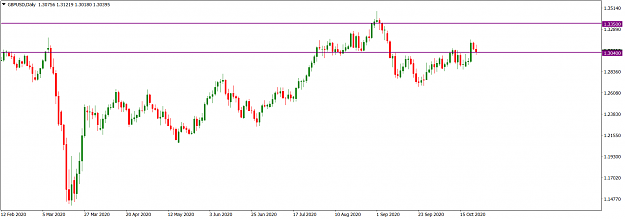
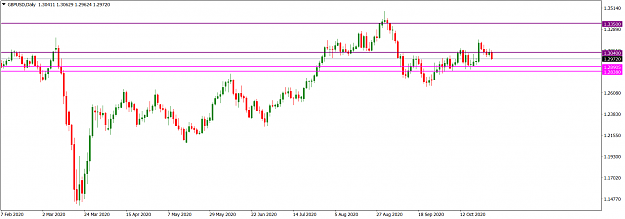
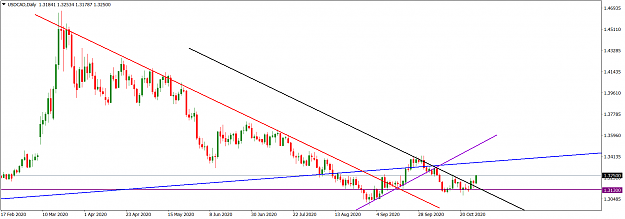
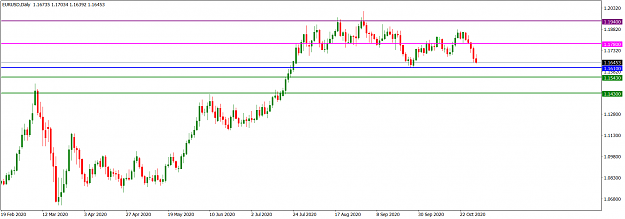
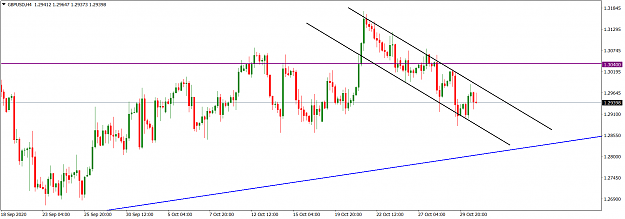
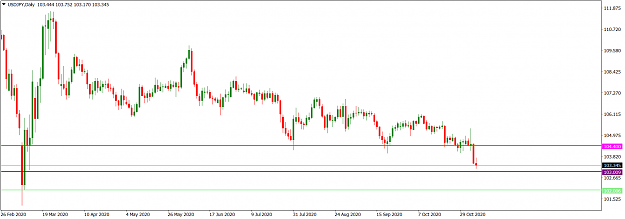
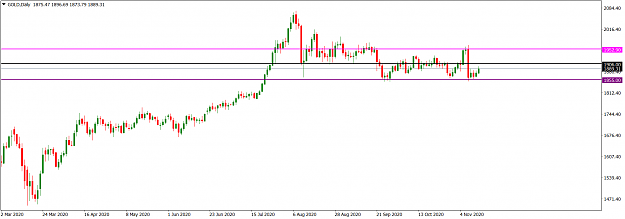
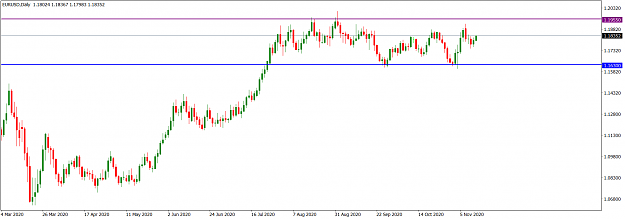
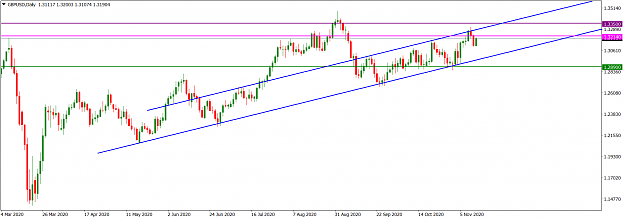
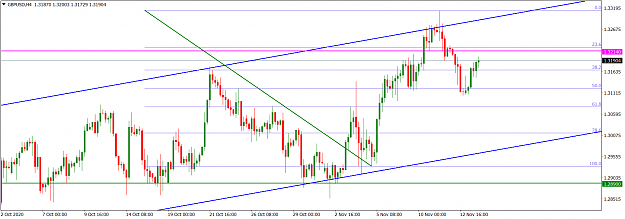
Technicals on the daily time frame favour bears. Price action has broken below a rising counter trendline (dark violet) to respect an emerging falling trendline (black).
I may be wrong. Trade safe and prosper.
KP
USDCAD market operation is at the 1.31300/1.29470 zone (purple) that has held as horizontal support since October 2018 after breaking below a rising trendline (blue) traceable to October 2012 in July.
Attached Image (click to enlarge)
Market operation on the weekly time frame is bearing southward after retesting a previous horizontal support zone around 1.34630/1.33800 (magenta) for a role flip. After a relatively big bearish candlestick was printed three weeks ago, the last two weeks have produced two opposing candlesticks for a sideways of market operation as it gets near to the 1.31300/1.29470 multi-year horizontal support zone (purple). However, the order flow context favours bears and, technically, we may see a southward continuation this week.
Attached Image (click to enlarge)
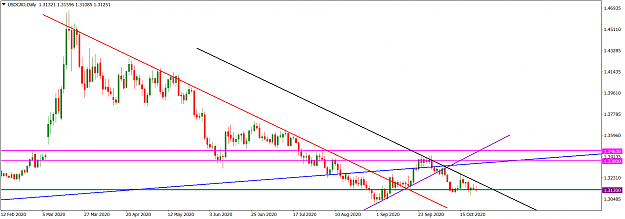
Technicals on the daily time frame favour bears. Price action has broken below a rising counter trendline (dark violet) to respect an emerging falling trendline (black).
Attached Image (click to enlarge)
I may be wrong. Trade safe and prosper.
KP
Do your homework, follow the footprints of smart money