NAS100 EOD
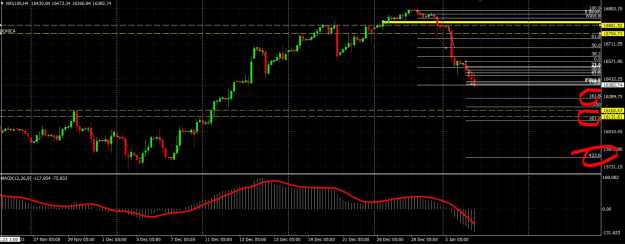
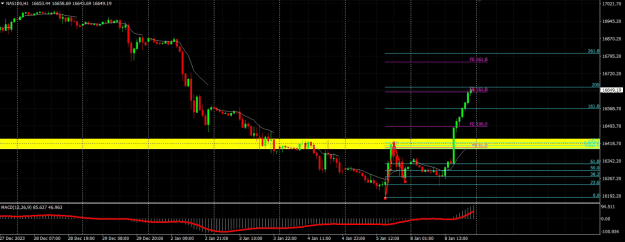
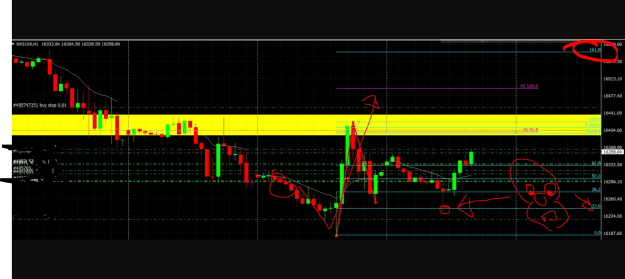
The daily time frame is still showing as Bullish. The move down today took us to a higher low, and while a Bearish Day that makes, it does not make the Daily chart on the whole so. In order for a chart to be bearish two previous lows need to be taken out.
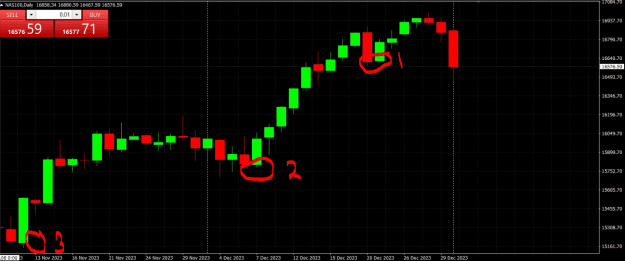
Currently it appears 16573 is resisting. this also happens to be the bottom of the last big liquidity dump. A few smaller ones came in and were quickly reversed. For now this one appears to be valid.
16438 is the second Higher low on the 1HR aka intra day charts. That coupled with the 261 fib hitting there from the high side. This appears to be my short term target. If only a wick touches it we could reverse, but it doesn't look like it ....yet.
The daily time frame is still showing as Bullish. The move down today took us to a higher low, and while a Bearish Day that makes, it does not make the Daily chart on the whole so. In order for a chart to be bearish two previous lows need to be taken out.
Attached Image (click to enlarge)
Currently it appears 16573 is resisting. this also happens to be the bottom of the last big liquidity dump. A few smaller ones came in and were quickly reversed. For now this one appears to be valid.
16438 is the second Higher low on the 1HR aka intra day charts. That coupled with the 261 fib hitting there from the high side. This appears to be my short term target. If only a wick touches it we could reverse, but it doesn't look like it ....yet.
When you feel like you HAVE to trade is when you least should!