good to include the 3 bar reversal in your arsenal. can be used at support and resistance structure or during a pullback. there are many versions in the internet though. https://www.tradingsetupsreview.com/...n-day-trading/
Can share this indicator? "When the 50 SMA is green, it indicates that the RSI is above the 50 horizontal line. When the 50 SMA is red, it indicates that the RSI is below the 50 horizontal line." I'm unable to use normal MA to do this in the main window. Thanks
Hi Inthebox, Can share this indicator? "When the 50 SMA is green, it indicates that the RSI is above the 50 horizontal line. When the 50 SMA is red, it indicates that the RSI is below the 50 horizontal line." I'm unable to use normal MA to do this in the main window. Thanks
Ignored
in post #1 ma rsi mtf alerts.
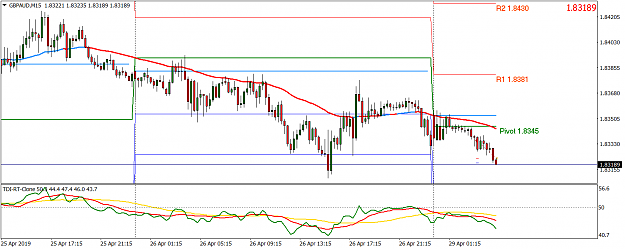
what day pivot do you use? i find the one i use here not so accurate when switching time frames.
{quote} in post #1 ma rsi mtf alerts. what day pivot do you use? i find the one i use here not so accurate when switching time frames.
Ignored
I use this pivot daily. Once in a while I check against this website (https://www.dailyfx.com/pivot-points) for accuracy. Think mine is working fine in between TFs.
hi i want to try ur strategy but there is a problem, when i put all indicators and template on my chart, my chart look like much different of yours.
And if i use a normal RSI + 2 SMA applied on RSI... they look different from the 2 SMA from template.
Any suggestion?
(sry for my bad english) @Inthebox: hi i want to try ur strategy but there is a problem, when i put all indicators and template on my chart, my chart look like much different of yours. And if i use a normal RSI + 2 SMA applied on RSI... they look different from the 2 SMA from template. Any suggestion? {image}
Ignored
the day pivot caused some problems and i have replaced it.
check with post #1 that you have the indicators below. and also the ej chart (last week only, not the sunday/monday candles)
{quote} Depending on which TF we looking at? EA - H1, PA is below day open and day pivot, 50SMA slope is down. EN - H1 and H4, PA below day open and day pivot, 50SMA is sloping down.
Ignored
as both htf h1 50 sma is sloping down and red.
just have to wait for ltf m5 or m15 to match.
{quote} as both htf h1 50 sma is sloping down and red. just have to wait for ltf m5 or m15 to match.
Ignored
In this case, do we focus on PA on m5/m15 once it goes below day open & pivot? TDI and 50SMA are lagging, price may have to move a few candles before we see TDI goes below 50 horizontal line. May be too late to enter then?