Hello.
would any of the codecs be so good and could help me.
Can anyone get MT5 Binary Robot
FX V-75 Scalper 3
BeanFX V-75 Scalper 3 strategy as explained in this article will assist Volatility Index 75 traders on how to scalp quick profits when trading Volatility index 75. This strategy is a combination of two Meta Trader 5 indicators.
Technically, the indicators are Moving averages and MACD. The ideal time frame for this strategy are 5 mins and 15 mins time frames
When the Red moving average cross the Blue moving average up, that is a BUY signal. When the Red moving average cross the Blue moving average down, that is a SELL signal.
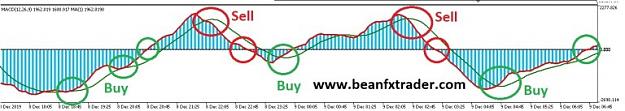
Indicator Window 1
MACD and moving average indicators are installed on Indicator Window 1 with the following settings:
Buy signal occurs when the Red moving average line cross up on the Green MACD signal line below the zero MACD level. Buy confirmation occurs when the Red moving average line cross above the zero MACD level.
Sell signal occurs when the Red moving average line cross down on the Green MACD signal line above the zero MACD level. Sell confirmation occurs when the Red moving average line cross down below the zero MACD level.
Take Profit and Stop Loss Levels
When buying, try to set your take profit at the nearest resistance. However, profit may can booked on a Buy position at the point when a sell signal occurs.
Stop loss for the buy trade may be placed below the recent support or swing low.
For a sell trade, try to take profit at the nearest support. However, try to take profit on short positions near the point when a buy signal shows up.
Stop loss for the short positions may be placed above the recent swing high or resistance.
would any of the codecs be so good and could help me.
Can anyone get MT5 Binary Robot
FX V-75 Scalper 3
BeanFX V-75 Scalper 3 strategy as explained in this article will assist Volatility Index 75 traders on how to scalp quick profits when trading Volatility index 75. This strategy is a combination of two Meta Trader 5 indicators.
Technically, the indicators are Moving averages and MACD. The ideal time frame for this strategy are 5 mins and 15 mins time frames
When the Red moving average cross the Blue moving average up, that is a BUY signal. When the Red moving average cross the Blue moving average down, that is a SELL signal.
Indicator Window 1
MACD and moving average indicators are installed on Indicator Window 1 with the following settings:
Buy signal occurs when the Red moving average line cross up on the Green MACD signal line below the zero MACD level. Buy confirmation occurs when the Red moving average line cross above the zero MACD level.
Sell signal occurs when the Red moving average line cross down on the Green MACD signal line above the zero MACD level. Sell confirmation occurs when the Red moving average line cross down below the zero MACD level.
Take Profit and Stop Loss Levels
When buying, try to set your take profit at the nearest resistance. However, profit may can booked on a Buy position at the point when a sell signal occurs.
Stop loss for the buy trade may be placed below the recent support or swing low.
For a sell trade, try to take profit at the nearest support. However, try to take profit on short positions near the point when a buy signal shows up.
Stop loss for the short positions may be placed above the recent swing high or resistance.
Attached Image(s) (click to enlarge)


Attached Images


