Dear Coders Can some one Add the Alerts (Native alert (popup), Sound alert, Email alert, Push notifications (mobile)) When Ever Market Touches Dynamic A Line. Kindly some one do the needful.
{quote} I am not here to judge you or anyone else, but I would like to respond to your apparent complaint about people asking for mq4 files, and offer a reasonable argument to justify it. Granted, there are bad people out there who will sell free stuff, attempting to profit from the hard work of others. Yes, it's wrong to do that. But what happens when an indicator that has been created to be used freely ends up not working anymore or turns out to have a bug. The user is pretty much stuck if the developer is no longer available to fix or update...
Ignored
Understandably, the above response, on surface, appears reasonable.
However, as general comment
- that was coder consensual modus operandi prior to the current rip-off situation - and it is regrettable it is no longer the case.
- most coders are no longer consensual to publishing their code as accessible via the *.mq4 file.
- so while the above quoted train of reasoning may have been acceptable prior to the current situation it is no longer valid and implies -> because you and others cannot code your own indicators, EA, etc., every coder must support your and others' coding inability at expense of supplying thieving parasites with vast amounts of free material to monetise.
- so a FREE *.ex4 no longer functions.
- light bulb moment: - > Tough - times have a changed ! That's when you and others with similar reasoning (again, understandable) cough up and pay for your lack of coding ability.
- you are, of course, at liberty to freely give away your paid for *.mq4 files.
- somehow, there does not appear to be a lot of paid for *.mq4 files freely floating around.
Honestly, we should all learn to program so that we don't depend on other people's goodwill. Due to the fact that other people do not help for free doing our homework, we were accommodated. Starting tomorrow I will study mql4 and mql5 programming.
Anyone have link to an EA which display in attached chart all the profits and losses daily, weekly, monthly etc.. sorted CurrencyPair wise in an account.
{quote} Understandably, the above response, on surface, appears reasonable. However, as general comment - that was coder consensual modus operandi prior to the current rip-off situation - and it is regrettable it is no longer the case. - most coders are no longer consensual to publishing their code as accessible via the *.mq4 file. - so while the above quoted train of reasoning may have been acceptable prior to the current situation it is no longer valid and implies -> because you and others cannot code your own indicators, EA, etc., every coder...
Ignored
Rightly captured in short words.
The basic thing is, if the coder likes to release mq4 let him release on request. There is no need to launch personal attacks on requester for unimaginable scenarios. Be kind to people of lesser strength.
{quote} I am not here to judge you or anyone else, but I would like to respond to your apparent complaint about people asking for mq4 files, and offer a reasonable argument to justify it. Granted, there are bad people out there who will sell free stuff, attempting to profit from the hard work of others. Yes, it's wrong to do that. But what happens when an indicator that has been created to be used freely ends up not working anymore or turns out to have a bug. The user is pretty much stuck if the developer is no longer available to fix or update...
Ignored
I believe in Open source code, anyway.
The basic thing is, if the coder likes to release mq4 let him release on request. There is no need to launch personal attacks on requester for unimaginable scenarios. Be kind to people of lesser strength.
{quote} I am not here to judge you or anyone else, but I would like to respond to your apparent complaint about people asking for mq4 files, and offer a reasonable argument to justify it. Granted, there are bad people out there who will sell free stuff, attempting to profit from the hard work of others. Yes, it's wrong to do that. But what happens when an indicator that has been created to be used freely ends up not working anymore or turns out to have a bug. The user is pretty much stuck if the developer is no longer available to fix or update...
Ignored
Thats some risk we must take for something FREE,
Want someone to coding and mql source go to FREElance
Any coders could private message me? I have an indicator that just needs a slight change. Instead of showing a line chart it should be Japanese candlesticks instead. Please see attached and private message me. If theres someone who can change it right away, please do so. Thanks a ton!
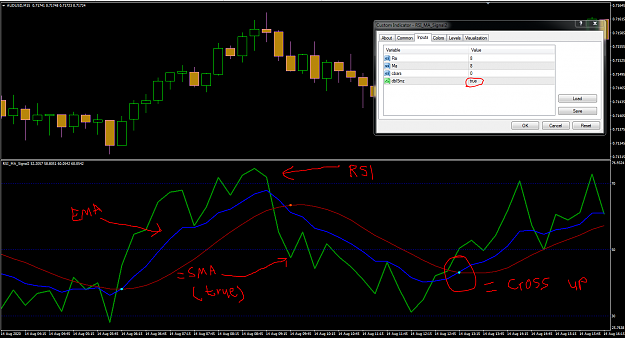
Hello, just to see if somebody can help me to interpret how to use this indicator, the Rsi part is Ok, but the lines and circles of the ema is abstract to me?{image} {file} Thanks
Ignored
Hi mate,
I can't really help with the intended use, but will quickly cover what it is showing.
The base indicator is RSI, then the blue line is an EMA introduced on top of the RSI data. So this is similar to a TDI.
Then you have that red line, it is an SMA that uses either the RSI data or the EMA data calculated from the RSI.
Setting the indicator to true on that last setting will use the RSI for the data to draw the SMA. False it will draw the SMA on the EMA data.
Now, when the EMA and this SMA cross, there is a dot formed. This dot will have different locations depending on how much lag is introduced by the SMA/EMA/RSI).
Possible uses could be to detect a change in trend, you would need to play with this indicator to test if there is any value in it for you.
Hope this helps ^_^
Attached Image (click to enlarge)
"Only you can Make the Future you will be proud to be a part of..." -Me
... needs a slight change. Instead of showing a line chart it should be Japanese candlesticks instead...
Ignored
Turning it into candles would be a very big change. It's an index indicator, meant to be a single line/single value per time, there's no ohlc values going on.
...interpret how to use this indicator, the Rsi part is Ok, but the lines and circles of the ema is abstract to me?...
Ignored
Green rsi base, blue ma of the rsi, red ma of the blue (just another way of having a double ma or a longer ma). Dots are ma crossovers. Potential use - defining rsi trend.
Here is a dashboard that I have modified so far to display the MACD trends for MTF and multi pairs,
It displays the actual state of the trend.
What I would like is to show as well since when the cross happened.
the arrows could be replaced by a number and the color would still indicate the direction or a number could be added next to the arrow.
Honestly, we should all learn to program so that we don't depend on other people's goodwill. Due to the fact that other people do not help for free doing our homework, we were accommodated. Starting tomorrow I will study mql4 and mql5 programming.
Honestly, we should all learn to program so that we don't depend on other people's goodwill. Due to the fact that other people do not help for free doing our homework, we were accommodated. Starting tomorrow I will study mql4 and mql5 programming.
Ignored
People are not equal, not the same. There are coders, there are traders. There are people with versatile abilities. There are greedy, there are generous. Thanks to those who share their time and talent with those who have neither the time nor the talent.
Dear Coders,
Request your help for attached indicator. If you could please embed a signal (arrow, dot e.t.c) when the red line / curve is almost at the extreme end. Top extreme end is for a down arrow (sell) and bottom end signal would be for a buy. I would like to use this indicator in a EA so would appreciate a buffer value for the arrows.
Many thanks,
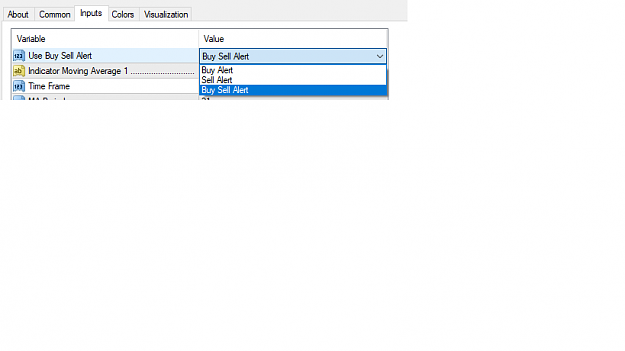
i have a very simple request. this indicator has all alerts in it. i want an option to use only buy/ only sell/ or both alerts as shown in the picture.... please help
{quote} Hi mate, I can't really help with the intended use, but will quickly cover what it is showing. The base indicator is RSI, then the blue line is an EMA introduced on top of the RSI data. So this is similar to a TDI. Then you have that red line, it is an SMA that uses either the RSI data or the EMA data calculated from the RSI. Setting the indicator to true on that last setting will use the RSI for the data to draw the SMA. False it will draw the SMA on the EMA data. Now, when the EMA and this SMA cross, there is a dot formed. This dot will...
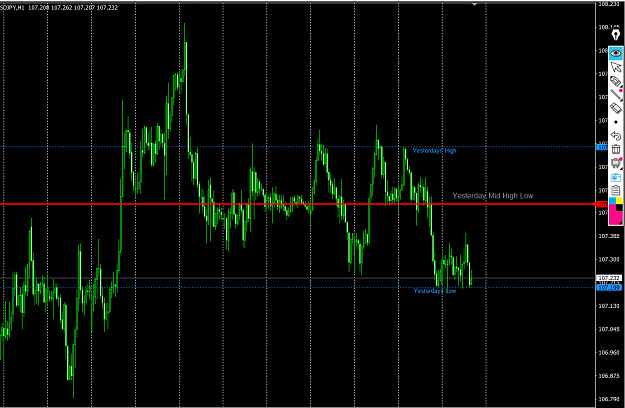
Hi dear coders, can anyone add few functions to this daily high low indicator ? ;
1. Add mid high low of previous day as shown in screenshot below + ( label as Yesterday Day Mid High Low )
2. Add to ability to select and display max of 10 days previous days low and high + ADD ABILITY to turn off mid of high low if selected to display only 10 days previous days low and high => the label for the other 9 previous high low mid of days will be written as the format ( Previous_No of Days _ high ) / (Previous_No of Days _ low ) / (Previous_No of Days _ mid ) -> example : Previous 2 Days High
3. Add previous mid , high , low of week & ability to select and display max of 5 weeks previous low and high + ADD ABILITY to turn off mid of high low if selected to display only 5 weeks previous low and high => the label FOR the 5 previous high low mid of weeks will be written as the format ( Previous_No of weeks _ high ) / ( Previous_No of weeks _ low ) / ( Previous_No of weeks _ mid ) -> example : Previous 2 Weeks High
4. Add previous mid , high , low of month & ability to select and display max of 5 months previous low and high + ADD ABILITY to turn off mid of high low if selected to display only 5 months previous low and high => the label FOR the 5 previous high low mid of months will be written as the format ( Previous_No of months _ high ) / ( Previous_No of months _ low ) / ( Previous_No of months _ mid ) -> example : Previous 2 Months High
5. Add ability to customize the color / width / type of horizontal line [ default being as shown in picture - dash line but different colors for previous week n month data ]
6. Add 3 separate toggle buttons for each previous month, weekly, daily data to show/hide all horizontal lines highs lows n mid for each individual time frame .
Institutional traders price in their orders at these key levels, if this indicator can be made it'll be one of or the most valuable indicator u could use for your trading !!
It is a pretty simple indicator but the data it gives to trader is important, sometimes simple is always the best
I appreciate if someone can work on this, thank you !!