GBPUSD Weekly Technical Outlook
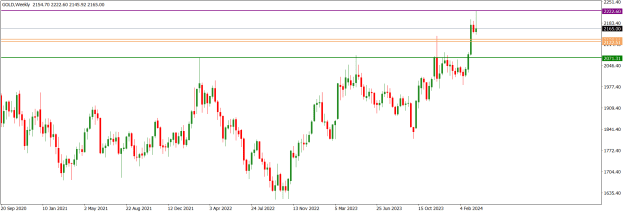
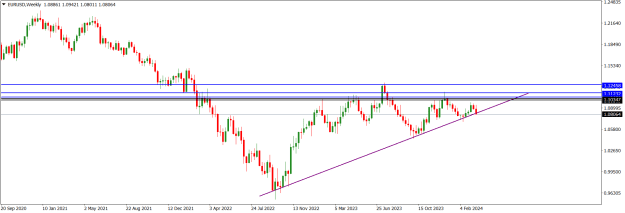
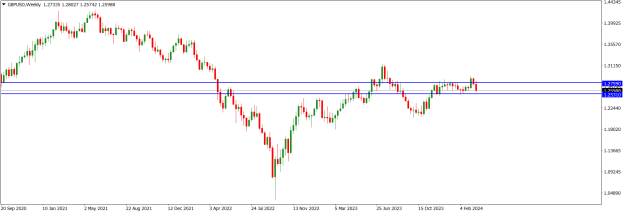
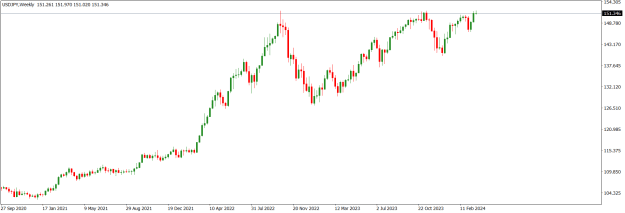
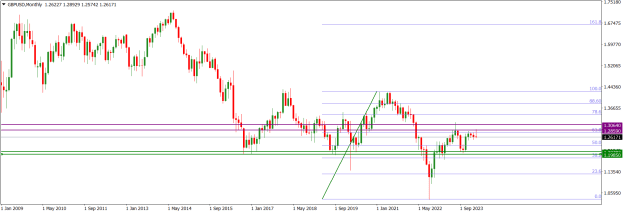
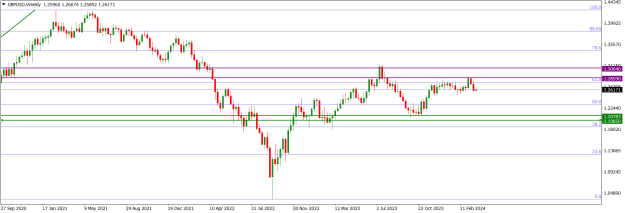
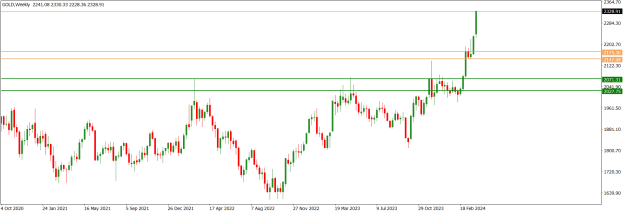
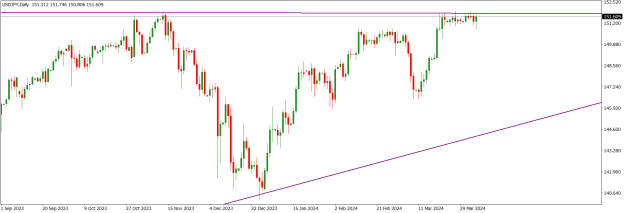
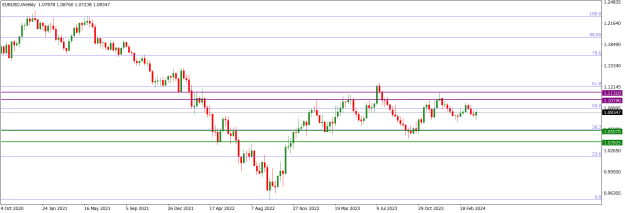
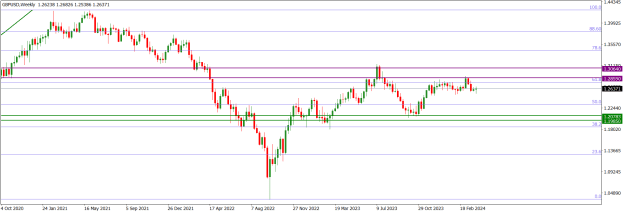
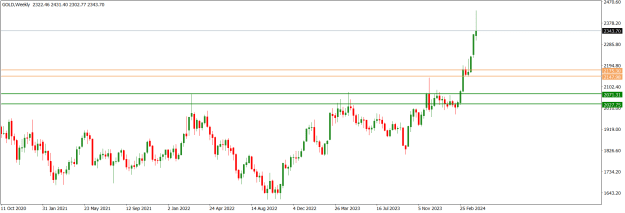
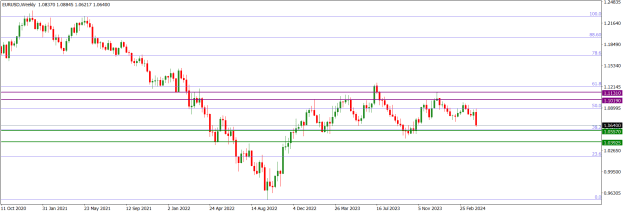
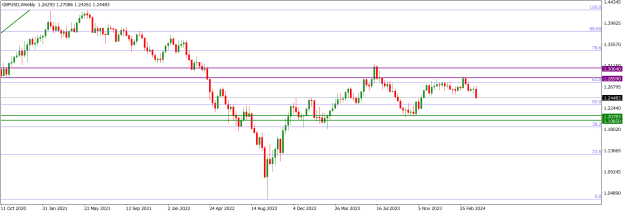
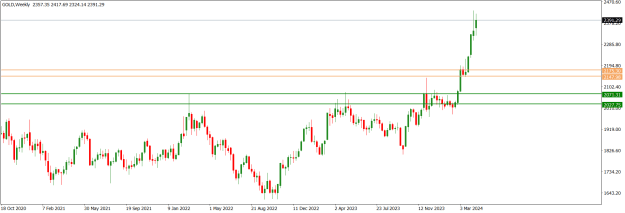
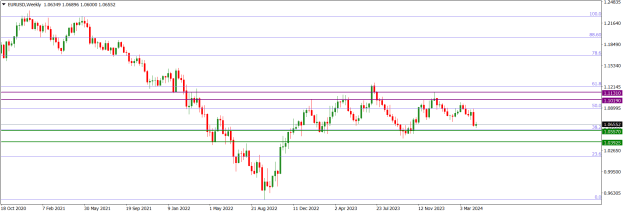
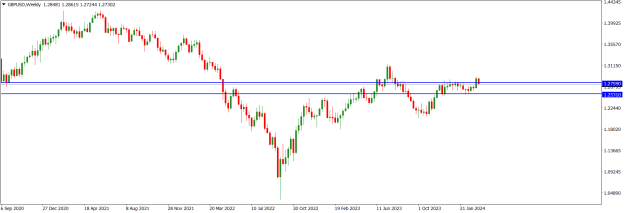
GBPUSD market operation on the weekly time frame printed a bearish candlestick last week. This was in opposition to the bullish candlestick printed the previous week. Technically, market operation is attempting a bullish breakout of the 1.25310/1.27590 horizontal channel (blue), which has been in place for several weeks.
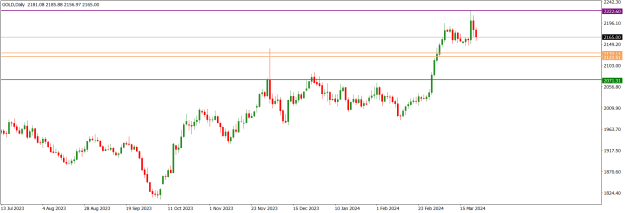
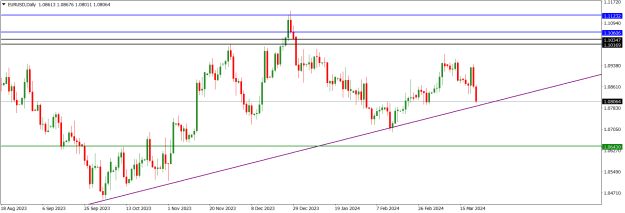
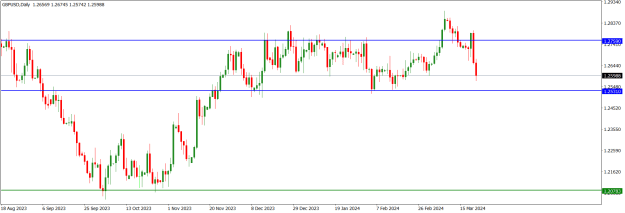
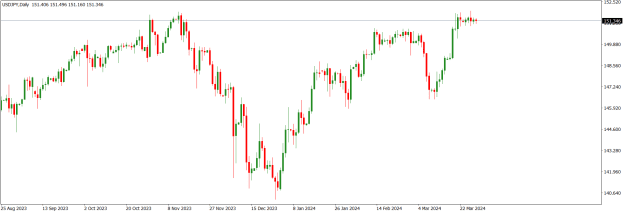
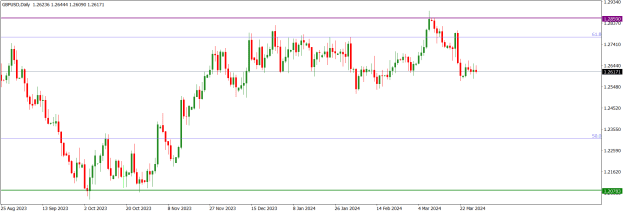
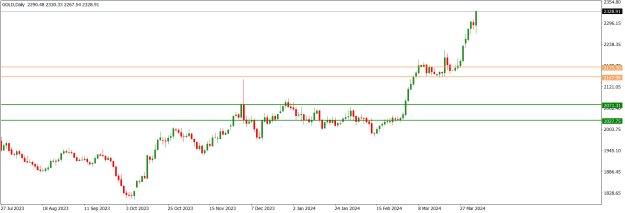
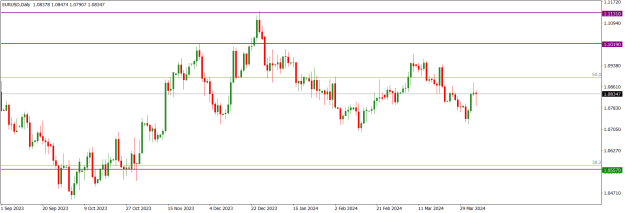
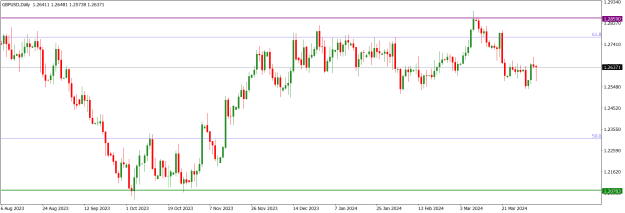
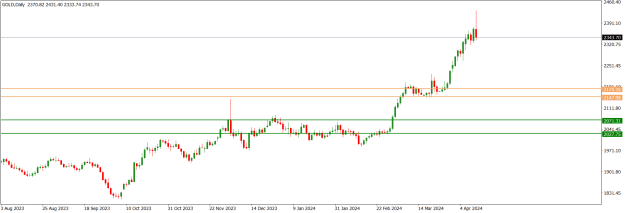
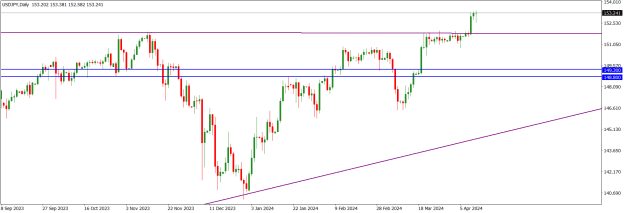
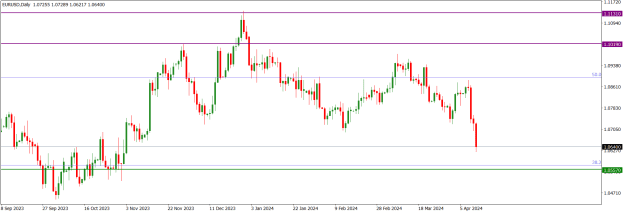
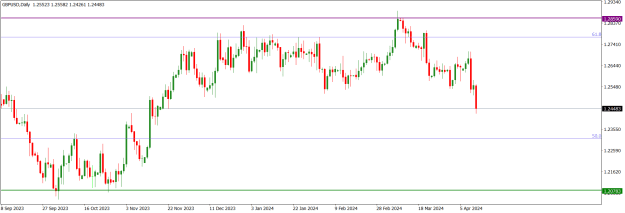
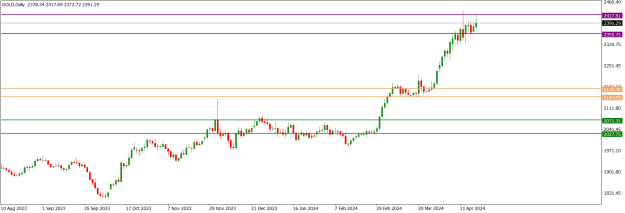
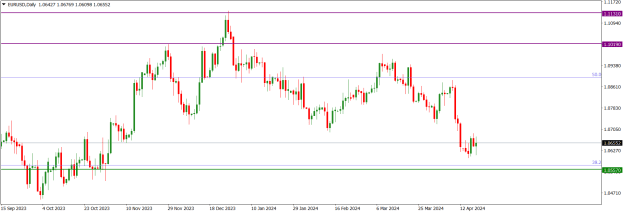
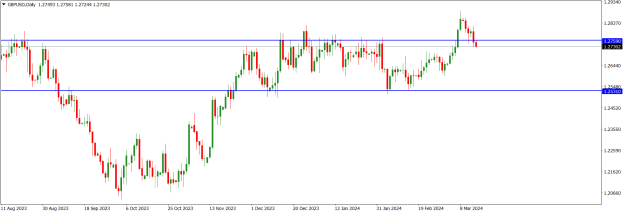
GBPUSD price action on the daily time frame broke out of the 1.25310/1.27590 horizontal channel (blue) several days ago but bears are pushing price action back into the channel. However, the bearish challenge is feeble as the bearish candlestick printed on Friday is smaller than the one printed on Thursday, and price action is still at the upper part of the channel. Besides, the technical impulse favours bulls more than bears.
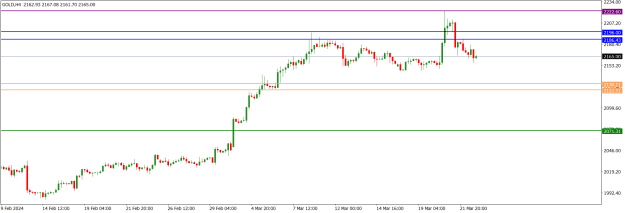
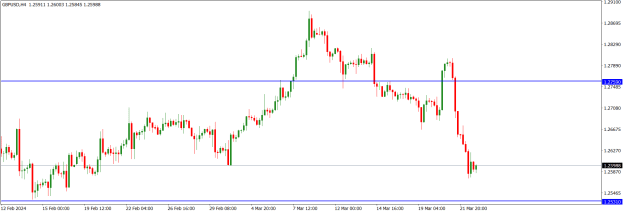
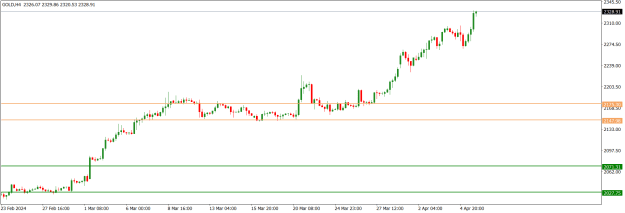
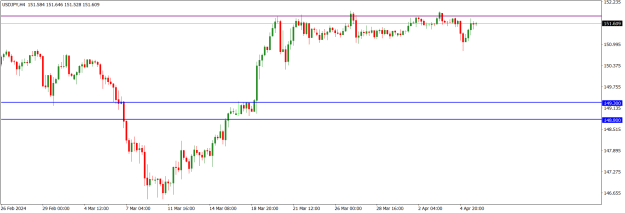
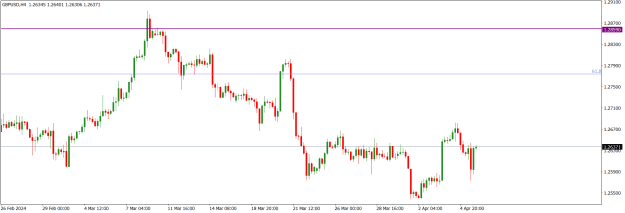
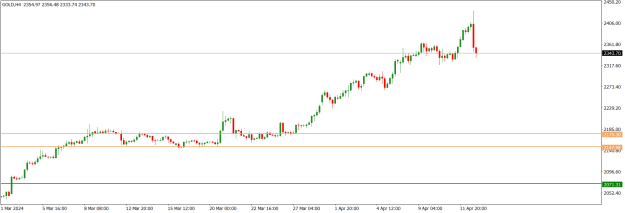
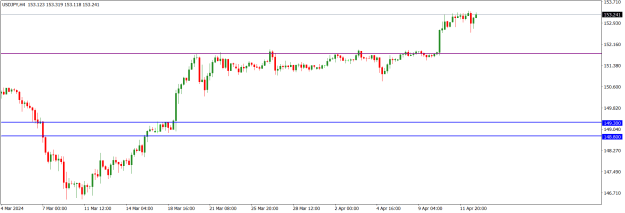
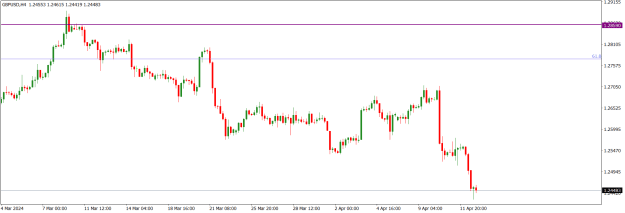
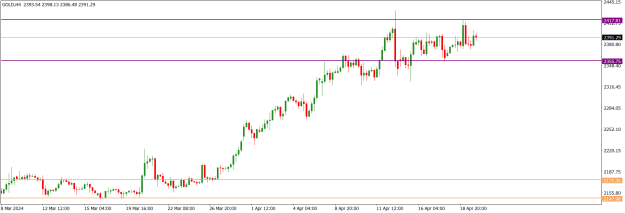
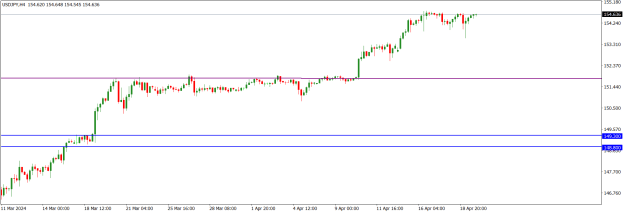
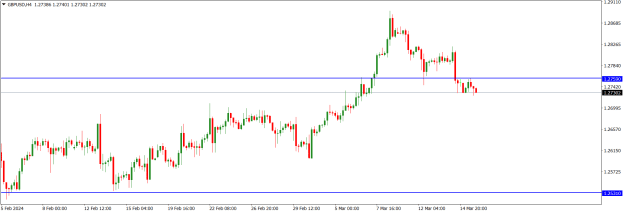
GBPUSD price action on the H4 time frame is presently ambivalent. Bears had challenged a bullish breakout of the 1.25310/1.27590 horizontal channel (blue), seen on the weekly time frame, but there is little southward momentum. Presently, price action is located at the 1.27300 intra-day support and the upper part of the channel. We cannot rule out further bullish drive.
I may be wrong. Trade safe and prosper.
KP
GBPUSD market operation on the weekly time frame printed a bearish candlestick last week. This was in opposition to the bullish candlestick printed the previous week. Technically, market operation is attempting a bullish breakout of the 1.25310/1.27590 horizontal channel (blue), which has been in place for several weeks.
Attached Image (click to enlarge)
GBPUSD price action on the daily time frame broke out of the 1.25310/1.27590 horizontal channel (blue) several days ago but bears are pushing price action back into the channel. However, the bearish challenge is feeble as the bearish candlestick printed on Friday is smaller than the one printed on Thursday, and price action is still at the upper part of the channel. Besides, the technical impulse favours bulls more than bears.
Attached Image (click to enlarge)
GBPUSD price action on the H4 time frame is presently ambivalent. Bears had challenged a bullish breakout of the 1.25310/1.27590 horizontal channel (blue), seen on the weekly time frame, but there is little southward momentum. Presently, price action is located at the 1.27300 intra-day support and the upper part of the channel. We cannot rule out further bullish drive.
Attached Image (click to enlarge)
I may be wrong. Trade safe and prosper.
KP
Do your homework, follow the footprints of smart money