Hi Coders 
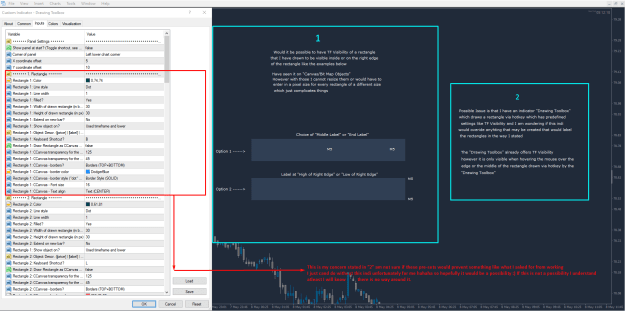
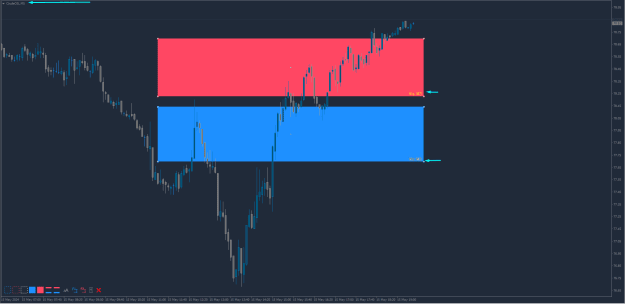
Would it be possible to create an Indicator/Tool that would automatically show TF Visibility as a text label inside or on the right edge of a rectangle that is drawn, either drawn by an indicator or manually?
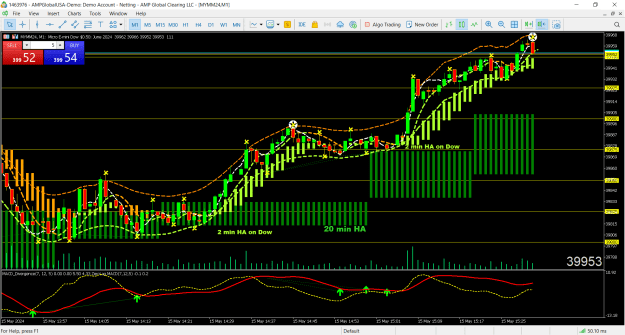
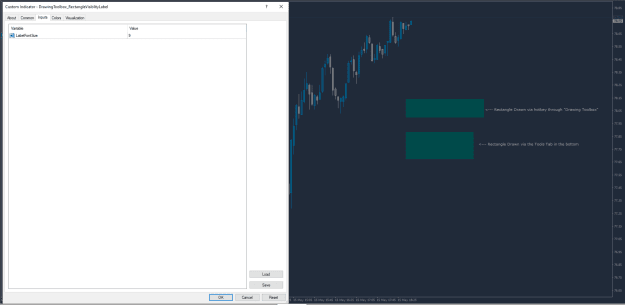
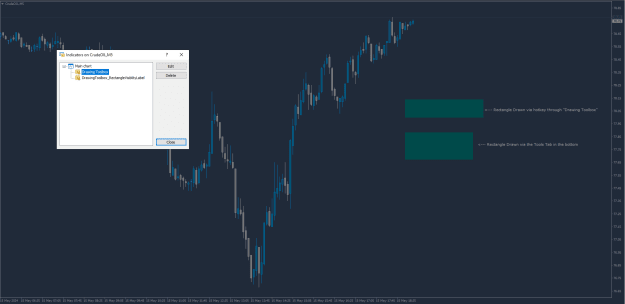
I ask in that way because I have an Indi/Tool that draws a rectangle via hotkey and with pre-sets already defined "Drawing Toolbox", and wonder if something created for the above purpose would either interfere or not work with this Indi/Tool on the chart...I cant do without the toolbox so not sure if there would be a work around in that instance...
I could and would draw the rectangles manually via the rectangle function in the toolbar if that would be the only viable work around in order to have what I am looking for...
The creator of the "Drawing Toolbox" hasnt been active since 2023 so thought I may ask here where there are coders present...not asking for a modification of the "Drawing Toolbox" or recreation, but rather something I could add to the chart that would perform that function to the rectangles drawn via the "Drawing Toolbox"
I don't like using the standard Object Description for the rectangle because often it is in the way of price when visible and quite frankly dont want to keep adding text to each one I draw as it moves with the chart and its a constant shift around and re-centre of the text which also gets a bit much after a while.
I have attached a screenshot to make more sense.
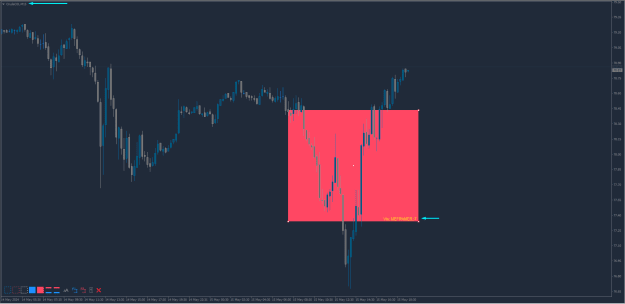
Would it be possible to create an Indicator/Tool that would automatically show TF Visibility as a text label inside or on the right edge of a rectangle that is drawn, either drawn by an indicator or manually?
I ask in that way because I have an Indi/Tool that draws a rectangle via hotkey and with pre-sets already defined "Drawing Toolbox", and wonder if something created for the above purpose would either interfere or not work with this Indi/Tool on the chart...I cant do without the toolbox so not sure if there would be a work around in that instance...
I could and would draw the rectangles manually via the rectangle function in the toolbar if that would be the only viable work around in order to have what I am looking for...
The creator of the "Drawing Toolbox" hasnt been active since 2023 so thought I may ask here where there are coders present...not asking for a modification of the "Drawing Toolbox" or recreation, but rather something I could add to the chart that would perform that function to the rectangles drawn via the "Drawing Toolbox"
I don't like using the standard Object Description for the rectangle because often it is in the way of price when visible and quite frankly dont want to keep adding text to each one I draw as it moves with the chart and its a constant shift around and re-centre of the text which also gets a bit much after a while.
I have attached a screenshot to make more sense.
Attached Image (click to enlarge)