No long intros, straight to the point.
There is a lot of academic articles about patterns (e.g .https://www.sciencedirect.com/science/article/abs/pii/S1568494619304818) and other methods of analyzing financial time-series. But ~99.99% of them are too difficult (for me) to understand and reproduce results.
Let's try to make things more down to earth.
Feedback, ideas, etc. are welcome. The further development of the thread depends on it.
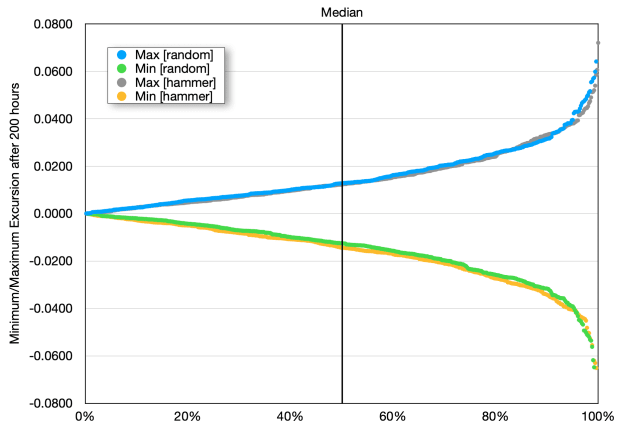
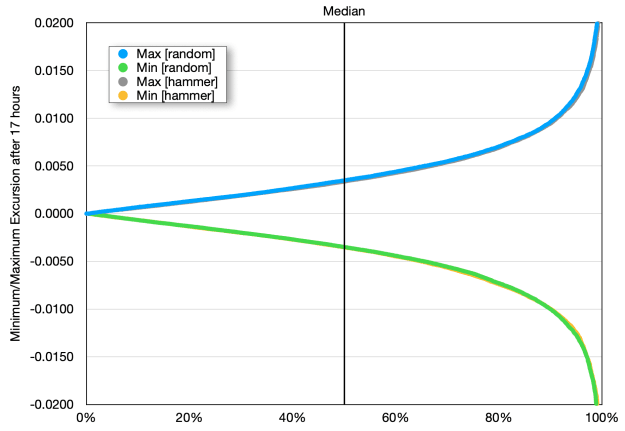
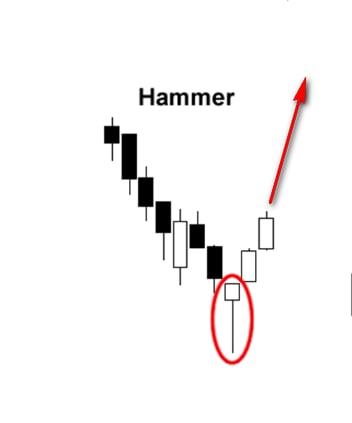
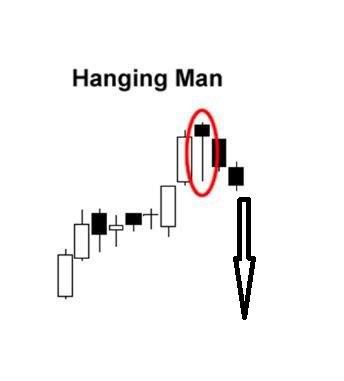
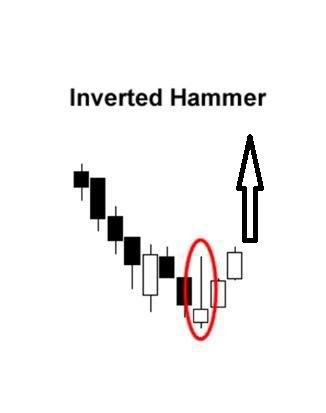
Hammer (https://www.forexfactory.com/thread/post/14886848#post14886848) = Inverted Hammer - No better than a random candle regardless of its location
There is a lot of academic articles about patterns (e.g .https://www.sciencedirect.com/science/article/abs/pii/S1568494619304818) and other methods of analyzing financial time-series. But ~99.99% of them are too difficult (for me) to understand and reproduce results.
Let's try to make things more down to earth.
Feedback, ideas, etc. are welcome. The further development of the thread depends on it.
Hammer (https://www.forexfactory.com/thread/post/14886848#post14886848) = Inverted Hammer - No better than a random candle regardless of its location