hmmmm... instead of evaluating pattern's predictive power, you should evaluate it with a strategy. Predictive power is only about win rate but you need expected value to make it work.
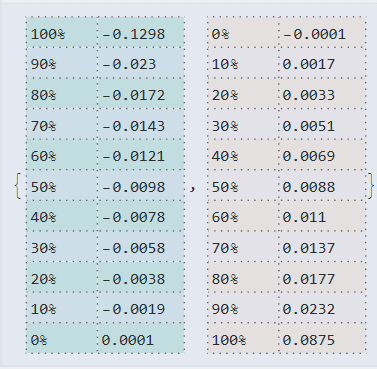
Moin. I've added 'reversal detection' - or name it better, - based on Stochastic, because I saw that condition somewhere. lw - lower wick uw - upper wick bd - body sk - StochasticK with lenght=14 lw > (bd*2) && bd < 50 && uw < 2 && sk < 20 → (lower wick is 2 or more times bigger then a body, body occupies less then 50% of a range, upper wick is less then 2% of a range) sk = 100 * (close - lowest(low, length)) / (highest(high, length) - lowest(low, length)) Final dataset was reduced from 496 to 72 cases Quantiles. {image} Random bear...
Ignored
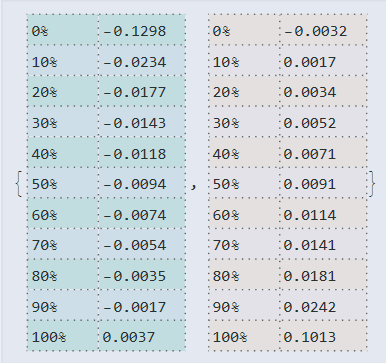
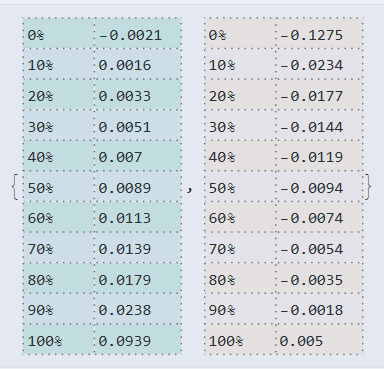
Omg, the results are even negativ if I interprete it correctly.
Is it really true that we have a hammer and stochastic "oversold" sk<20:
50% 0.0107 to 50% -0.0137 ??
also invertet hammer with context sk<20:
50% 0.0132 to 50% -0.0148
These figures are horrible.
What supports the thesis that banks and marketmakers "use" old (working) strategies out of trading books to suck people into market who apply it and take their money. I think the easier the signal is generated, the easier it is possible to reverse it (costs of reversing is little compared to the money you earn). That would explain why signals like hammer or inverted hammer are not working solely anymore - or even are abused to suck people onto a wrong path.
Now the question is: can you reduce the negative outcomes of hammers by using a SL to avoid max. DD? Here in the test it is only the highest point and lowest point after a certain amount of time used. A SL could change that outcome. Due to my experience a SL is useless. You reduce your max. DD but you also have more losing trades with reduces the max. avg. profit a lot.
What we can see here is using another technique to avoid bad trades:
Attached Image (click to enlarge)
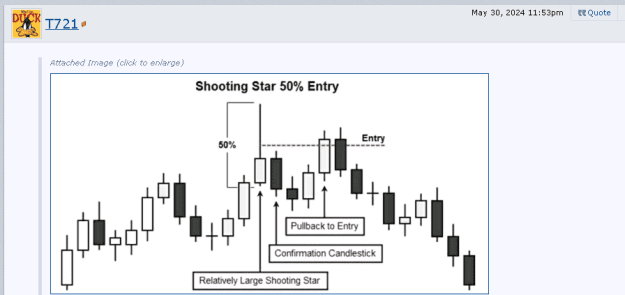
T7 21 doesn't enter on the signal but later, when the signal get confirmed. - Of course the main signal than is already gone but the power of it could last longer like in the example from T7 21. So you use the signal only after a pullback. That is a very common entry strategy for breakouts. You wait for the confirmation. But this is also a good example how complex a backtest can get if you really want to backtest it automatically. Due to my experience I can say that T7 21's approach of backtest will probably on the limit to test with one computer (even with the power of today's cpu) on 1 minutes base for one year for one currency.
What supports the thesis that banks and marketmakers "use" old (working) strategies out of trading books to suck people into market who apply it and take their money.
Ignored
Ok, perhaps a bit off-topic, but I doubt marketmakers do that. There are thousands of possible strategies they would all need to sabotage. No, most traders are "gamblers" (Martingale, Grid, Averaging Down, etc.) and will themselves take care of giving their money to the marketmakers. What marketmakers can (and will) do, however, is sabotage the execution of trades. Slightly more spread, slightly more slippage, network problems just when you are about to hit your TP, etc. MetaQuotes even sells a module specifically designed for tampering with "enhancing" the execution to brokers that offer MT4 or MT5!
What is interesting to try out, however, is to check whether these "old (working) strategies out of trading books" did indeed work in the past. We could backtest that on old historical data.
Joined Dec 2020
|
Status: 100% BAVOVNA
|1,453 Posts
Important reference post
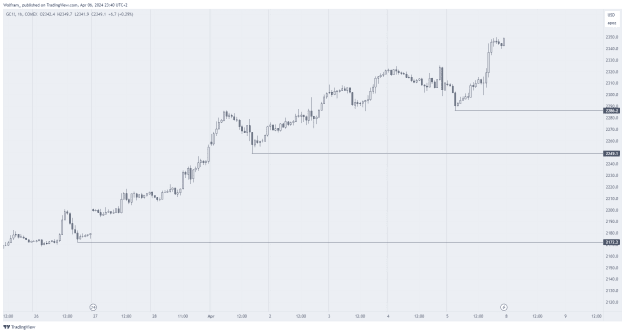
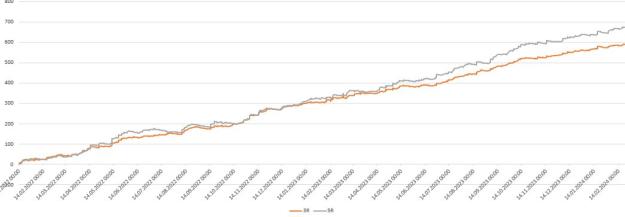
Stats for GU, hourly
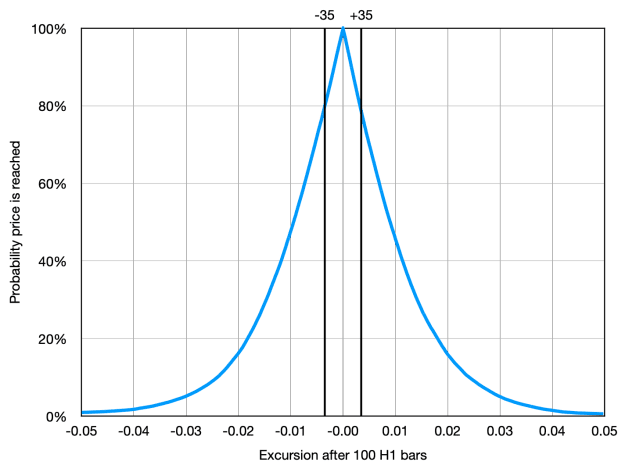
If one decides to go short after any bearish candle and wait for (t) <=100 hours, there is 80% chance to gain 35 pips (green)
If one decides to go long after any bearish candle and wait for (t) <=100 hours, there is also 80% chance to gain ~35 pips (yellow)
Attached Image (click to enlarge)
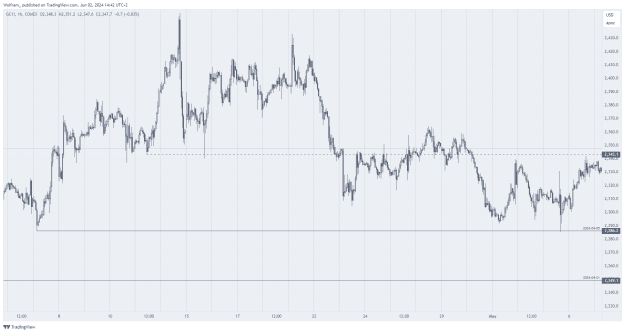
Or go long/short after any bullish candle
Attached Image (click to enlarge)
If you see an arrogant 'experienced' trader, who has ben trading patterns for ~20 years, show him this.
If one decides to go short after any bearish candle and wait for (t) <=100 hours, there is 80% chance to gain 35 pips (green) If one decides to go long after any bearish candle and wait for (t) <=100 hours, there is also 80% chance to gain ~35 pips (yellow)
Ignored
Yes, I was able to reproduce your observation! Here is a histogram of the price excursion on GU after 100 H1 bars:
If you see an arrogant 'experienced' trader, who has ben trading patterns for ~20 years, show him this.
Ignored
Well, now it looks like you can easily make 35 pips, but the question is what to do in the 20% of the cases that the price is NOT hit! Without a good strategy you will give away the 4 x 35 pips you made earlier.
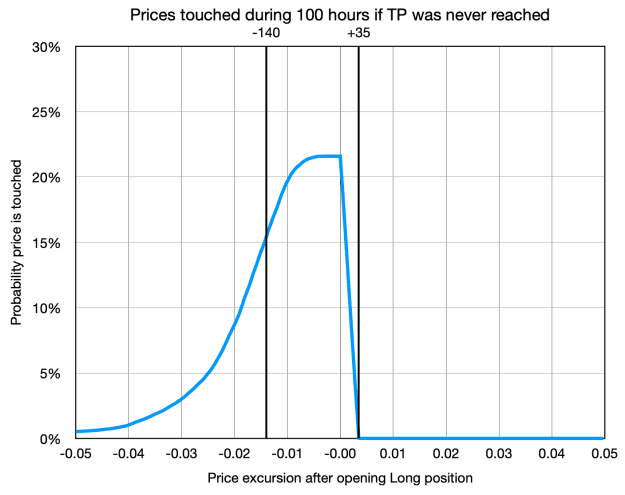
Suppose we go long and set a TP at +35 pips. In those 20% of the cases the TP was not reached, what prices did it touch?
Attached Image (click to enlarge)
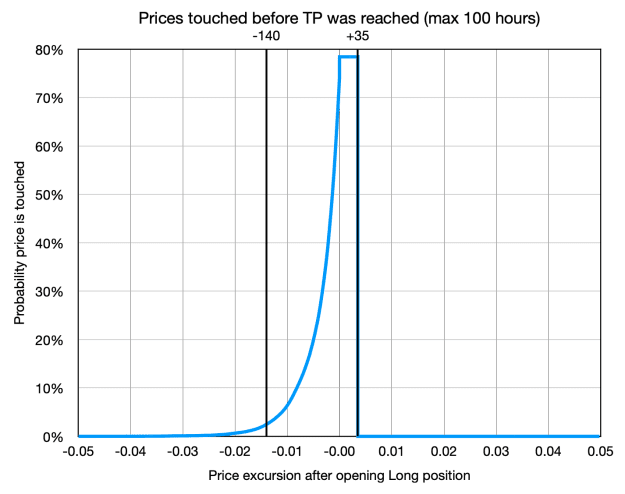
In those 80% of the cases the TP was reached, what prices did it touch before reaching the TP?
Attached Image (click to enlarge)
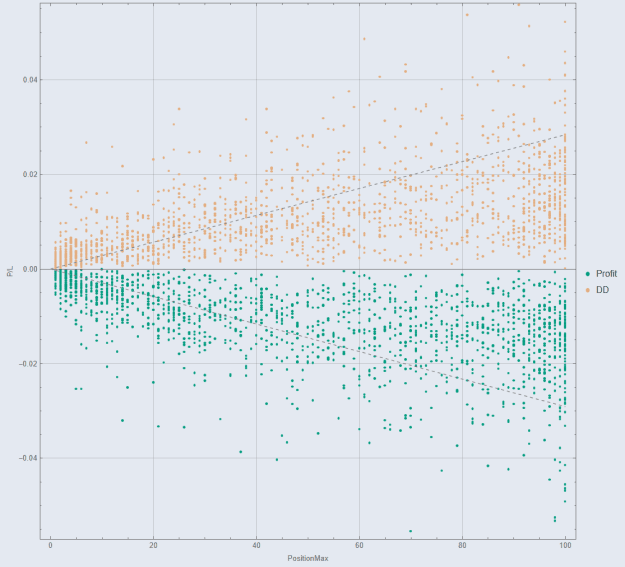
It is this last graph that shows why it is not trivial to make money even if prices reach +35 pips in 80% of the cases. Even if you set a very wide SL at -140 pips (=Break even, (80%/20%)x35 pips), it will be touched in 2.5% of the cases that would otherwise eventually have hit TP.
Suppose we go long and set a TP at +35 pips. In those 20% of the cases the TP was not reached, what prices did it touch? {image} In those 80% of the cases the TP was reached, what prices did it touch before reaching the TP? {image} It is this last graph that shows why it is not trivial to make money even if prices reach +35 pips in 80% of the cases. Even if you set a very wide SL at 4x35 pips, it will be touched occasionally in which case you miss out on the TP, thus lowering the 80%.
Ignored
I cannot see your attachment but I know probably already the result: in the other 20% your avg. loss will be -140 pips, correct? That would fit R:R of 1:1.
So:
80% of the time = 35 pips
20% if not hit: = -140 pips
equals R:R of 1:1.
Quote Yoriz: "Even if you set a very wide SL at 4x35 pips, it will be touched occasionally..." - that's the problem I had in lots of studies. It seems it is too trivial just using a SL.
in the other 20% your avg. loss will be -140 pips, correct? That would fit R:R of 1:1. So: 80% of the time = 35 pips 20% if not hit: = -140 pips equals R:R of 1:1.
Ignored
Even worse: as you can see in the graph, sometimes price first visits -140 pips before reaching the +35 pips TP. So by exiting your trade at -140 pips you miss out on what could have been a TP. So the 80% number will no longer be correct and will be lower once you start using a -140 pips SL.
Important reference post Stats for GU, hourly If one decides to go short after any bearish candle and wait for (t) <=100 hours, there is 80% chance to gain 35 pips (green) If one decides to go long after any bearish candle and wait for (t) <=100 hours, there is also 80% chance to gain ~35 pips (yellow) {image} Or go long/short after any bullish candle {image} If you see an arrogant 'experienced' trader, who has ben trading patterns for ~20 years, show him this.
Ignored
nice, but you must sharper that query and add context.
like previous daily candle or more, bearish or bullish to now the internal hourly structure.
i saw once stats of something similar, if last 2 daily candles are green, place buy after bearish hour
{quote} Omg, the results are even negativ if I interprete it correctly. Is it really true that we have a hammer and stochastic "oversold" sk<20: 50% 0.0107 to 50% -0.0137 ?? also invertet hammer with context sk<20: 50% 0.0132 to 50% -0.0148 These figures are horrible. What supports the thesis that banks and marketmakers "use" old (working) strategies out of trading books to suck people into market who apply it and take their money. I think the easier the signal is generated, the easier it is possible to reverse it (costs of reversing is little compared...
Ignored
Quote
Disliked
Is it really true that we have a hammer and stochastic "oversold" sk<20:
50% 0.0107 to 50% -0.0137 ??
also invertet hammer with context sk<20:
50% 0.0132 to 50% -0.0148
According to that empirical distribution - yes.
it's a horror but I'll continue to test other patterns this way, even if its showing no_better_than_random results so far.
Quote
Disliked
Now the question is: can you reduce the negative outcomes of hammers by using a SL to avoid max. DD?
For me SL, R:R are rather harmful concepts that put spoke in a wheel. Like I said earlier, this stats should be traded 1:1 leverage (x<=0.1 lot for 10k acc...), without SL (if broker allows, than use 'hedging' to offset risk) and multiple entries to average position.
Off-topic: similar idea with high probability but requires very high DD tolerance https://www.forexfactory.com/thread/post/14821764#post14821764
Suppose we go long and set a TP at +35 pips. In those 20% of the cases the TP was not reached, what prices did it touch? {image} In those 80% of the cases the TP was reached, what prices did it touch before reaching the TP? {image} It is this last graph that shows why it is not trivial to make money even if prices reach +35 pips in 80% of the cases. Even if you set a very wide SL at -140 pips (=Break even, (80%/20%)x35 pips), it will be touched in 2.5% of the cases that would otherwise eventually have hit TP.
Ignored
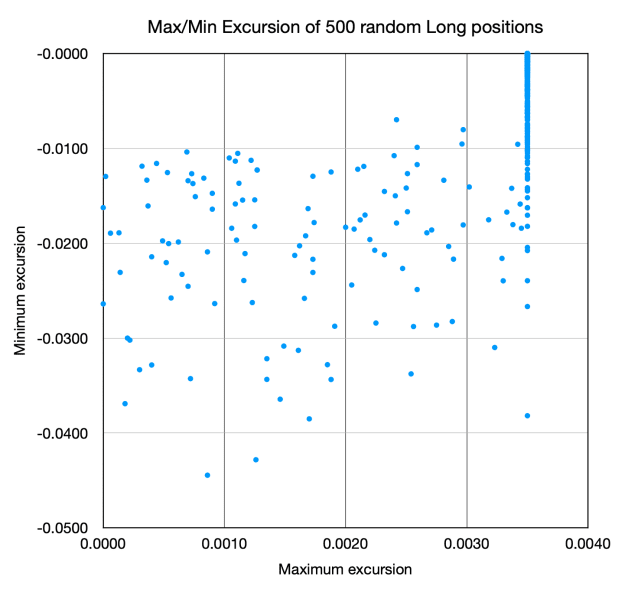
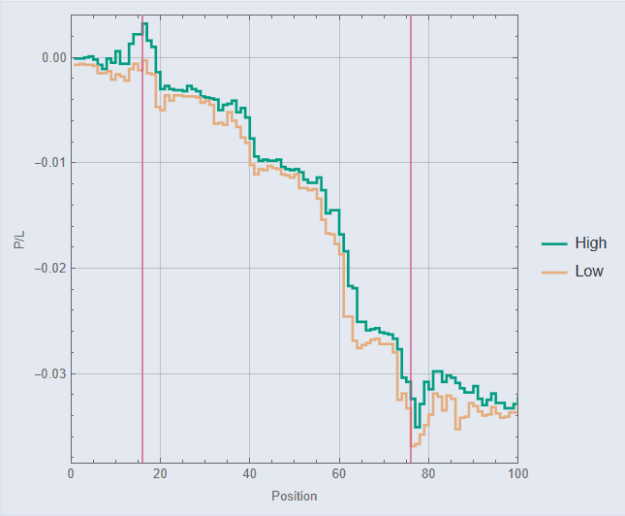
Idk if I'm doing the same thing rn, but here is some thoughts:
- Let's take TP {20 < x < 35} pips
- analyze positions in a sequence at which TP was reached and position of min_price
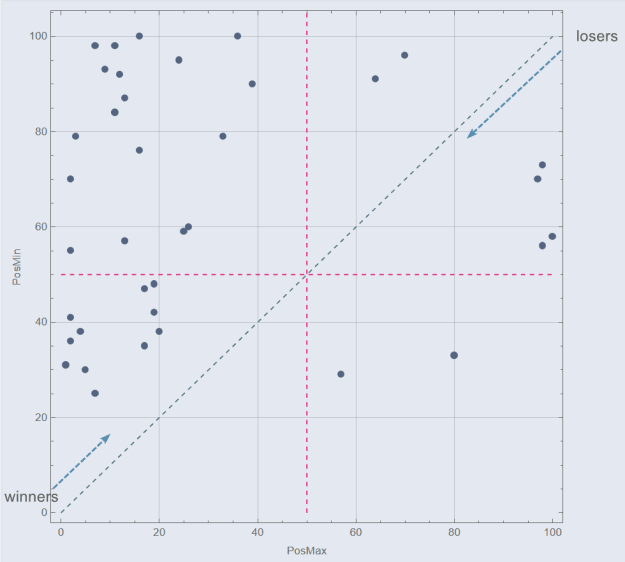
- on a scatter plot we would like to see points are clustered above the line of equality (x=y)
Under this conditions price hits tp in 85% of the cases before going too deep: {-0.0102, -0.01, -0.0154, -0.0119, -0.0109, -0.0085}
Please check for 154 pips with your algorithm. Is it the same thing?
Attached Image (click to enlarge)
In post#2 there was a table attached for a sequence of 200 candles
Here I used data from 100
Please check for 154 pips with your algorithm. Is it the same thing?
Ignored
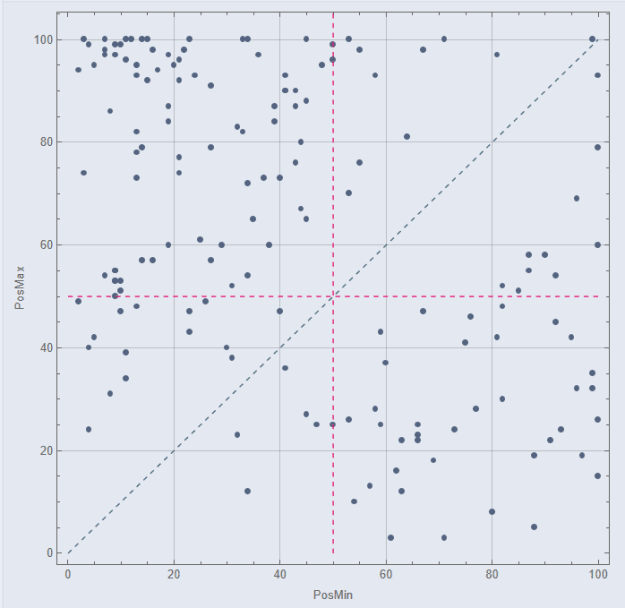
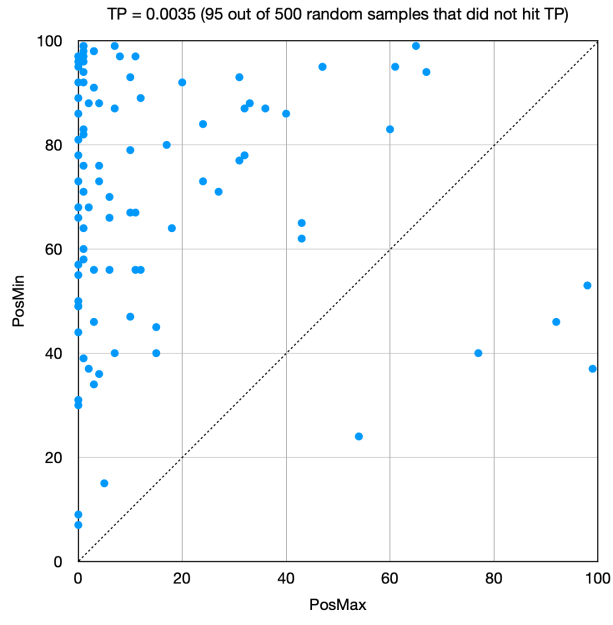
Happy to check, but I am not sure how to read your scatter plot. If you put the TP at 35 pips, and the dots represent all cases were the TP was hit, then I expected all the dots to be on a vertical line at PosMax=35 pips with various PosMin pips.
For example, here I made a scatter plot with TP=35 pips with both winning trades (the rightmost dots) and trades that never hit TP in 100 hours:
Attached Image (click to enlarge)
Your scatter plot looks different. Can you please elaborate?
{quote} Happy to check, but I am not sure how to read your scatter plot. If you put the TP at 35 pips, and the dots represent all cases were the TP was hit, then I expected all the dots to be on a vertical line at PosMax=35 pips with various PosMin pips.
Ignored
I should have explained the variables, sorry.
PosMax is a position in a sequence where the maximum high occurred. PosMin - position of lowest low
I set tp in the interval {0.002 < x < 0.0035}, otherwise x>=0.0035 all the extreme DD comes out and plot becomes noisy
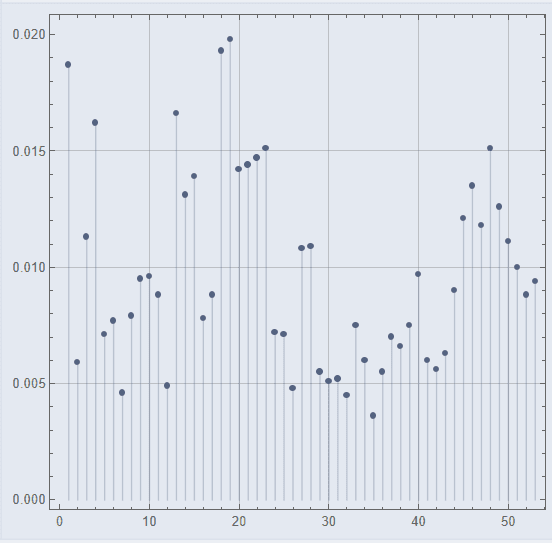
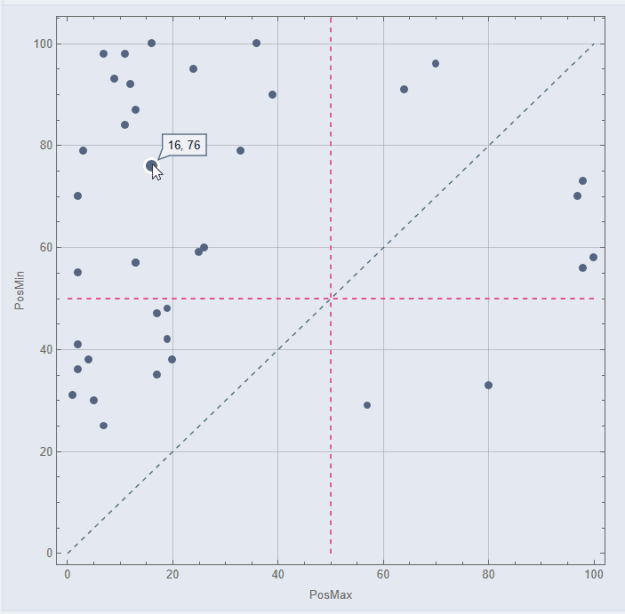
For example:
Attached Image (click to enlarge)
and that case on scatter plot:
Attached Image (click to enlarge)
Dots above equality line indicates that profit achieved first
PosMax is a position in a sequence where the maximum high occurred. PosMin - position of lowest low
Ignored
Ok, clear. I'll try to reproduce your result. So your assumption is that when a candle pattern has any predictive power, you expect to get a high before a low (in case of a Buy)?
What is not clear to me is how you intend to make money with this finding. Of course it helps if the high occurs before the low, but you don't know beforehand how high the high will be. Trailing stop?
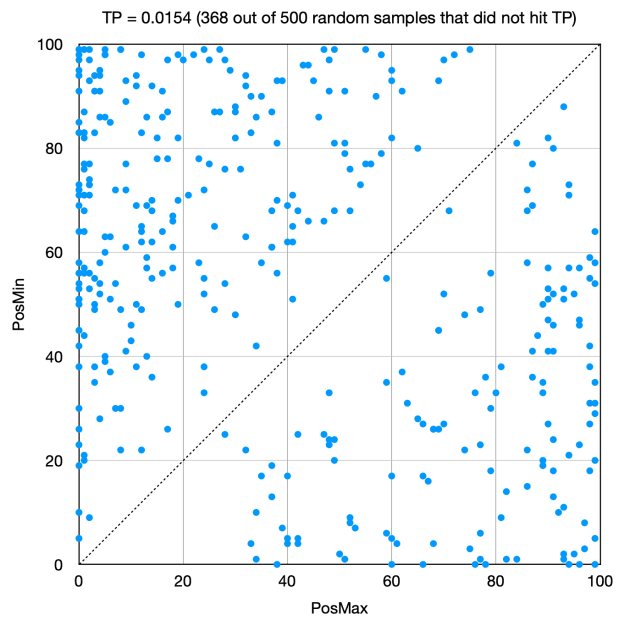
TP = 154 is too much for only 100 H1 bars. But with TP = 35 you can see clear patterns similar to your plot in post #55 (https://www.forexfactory.com/thread/post/14887349#post14887349). Unfortunately, a lot of dots are near the leftmost border which means price started to go south right after opening the Buy position.
Joined Dec 2010
|
Status: Foook Bollinger-dr.Kegel knows!
|9,751 Posts
Nice thread...if only I would know how to properly code. Still, im doing the leg work for more than a decade in algo-systematic mechanical world. Tired a bit to be honest.
What I have stumbled is next which seems very important to me...when I moved away from targeting win rate % as my primary goal, then curves started to appear.
1:3RR is a sweet zone in my opinion.
Perhaps in the direction of 3 candle fractals; and always trying to lean on the side of higher rewards.
{quote} Ok, clear. I'll try to reproduce your result. So your assumption is that when a candle pattern has any predictive power, you expect to get a high before a low (in case of a Buy)? What is not clear to me is how you intend to make money with this finding. Of course it helps if the high occurs before the low, but you don't know beforehand how high the high will be. Trailing stop?
Ignored
Quote
Disliked
So your assumption is that when a candle pattern has any predictive power, you expect to get a high before a low (in case of a Buy)?
Correct. Some momentum lasting tn should follow if the candle has significance, imho.
Quote
Disliked
Of course it helps if the high occurs before the low, but you don't know beforehand how high the high will be. Trailing stop?
TS as an option, also I trade without SL so want to know how much DD to expect