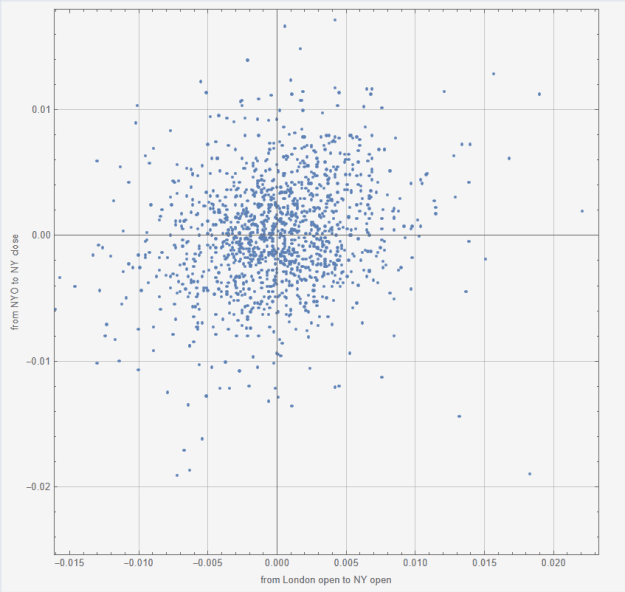
Disliked{image} {image} TP = 154 is too much for only 100 H1 bars. But with TP = 35 you can see clear patterns similar to your plot in post #55 (https://www.forexfactory.com/thread/post/14887349#post14887349). Unfortunately, a lot of dots are near the leftmost border which means price started to go south right after opening the Buy position.Ignored
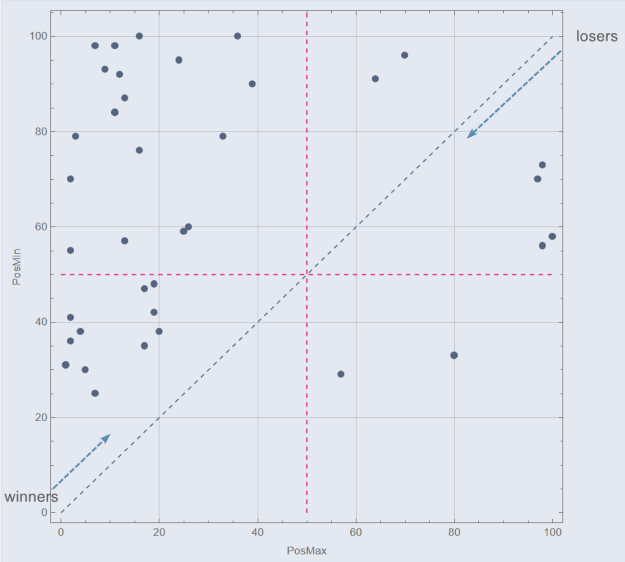
My reasoning is as follows:
- take a sequence of consecutive highs after Hammer was detected
- find the max.value and its position in a list
- take a sequence of consecutive lows - find the min.value and its position (= I have 4 lists)
- transpose it into a nested list {{max.val, min.val, posMax, posMin}, ...}
- select only those with max.val < 0.0035
- I got {{0.0032, -0.0207, 9, 93}, {0.0028, -0.014, 11, 98}, ..., {0.0009, -0.0198, 3, 83}, ...}. 110 sublists in total
- in first two examples profit is ~30 pips and comes very fast, good. I can easily use TS... the con is, high can be as low as 1 pip
- {0.0032, -0.0207, 9, 93} here the low is -207 pips, but I don't care bc it's @ position 93 and after I took profit, so not a DD
- I'm interested in 8 points below equality line, these are the cases where the lowest low comes first
- lowest lows/min.val/max DD {-0.0102, -0.01, -0.0086, -0.0154, -0.0119, -0.0114, -0.0109, -0.0085}. Highest highs {0.0025, 0.0027, 0.0019, 0.0021, 0.0028, 0.0019, 0.0024, 0.0024}
- set interval 0.002 < max.val < 0.0035. Dataset = 38 cases. 32/38 - we have at least 20 pips profit before the price dipped. 6/38 - be ready for DD ~154 pips (ok, let's make a room for future, 200 pips(?) )
- Attached Image (click to enlarge)
- theoretically, we need >80% winrate to deal with avg R:R to overcome this conditions. 1) we have. 2) increase SL or don't use it
Probably not the things that books and shitty bloggers tells us![]()
1