{quote} all...absolutely nothing changes...currencies...indexes..stocks..metals...just find the PRICE/TIME ratio and put the graph in scale. without scale you can NOT see the geometry. I use MT4 and obviously it's fine on any time frame, that's why lately I've put 5-minute graphs but I could also put 1-minute ones...obviously the resulting movements are smaller. it's the same as the 123 of ROSS: when point 2 is exceeded on a monthly chart, the rise will be for example 1000 pips.... when point 2 is exceeded on a 1 minute chart the rise will perhaps...
Ignored
for scale chart just do a right click and check fix one to one, or is necessary set fix scale whit diffrent input?
Beautiful chart that shows a truth. I say it in the words of Michael Jenkins:"One can truly meditate for hours on the beauty of this chart and what it means for the rational deterministic choices for mankind". The Secret Science p.48
Everything is GOD, the rest is an illusion.
{quote} for scale chart just do a right click and check fix one to one, or is necessary set fix scale whit diffrent input? is there someone which use the overlap strategy?
Ignored
right click and check fix one to one....it would be too easy...each cross has its own scale based on price and time frame. sometimes on the same time frame I have 2 different ratios to widen or narrow the graph....the exact same system that GANNTRADER uses.
not in the sense that I use the same ratio as the Ganntrader but in the sense that the ganntrader also changes the scale if you move forward or backward with the chart or if you increase the number of bars: this for the simple reason that the volatility/height of the chart changes. .I hope I have explained myself
what do you mean by "overlap strategy"? do you perhaps intend to compare a specific period in the past with current prices to obtain a forecast?
spiegati in italiano così capisco meglio...grazie
{quote} right click and check fix one to one....it would be too easy...each cross has its own scale based on price and time frame. sometimes on the same time frame I have 2 different ratios to widen or narrow the graph....the exact same system that GANNTRADER uses. what do you mean by "overlap strategy"? do you perhaps intend to compare a specific period in the past with current prices to obtain a forecast? spiegati in italiano così capisco meglio...grazie
Ignored
E' la strategia che viene spiegata da jenkins nel suo libro Basic day trading
EURUSD 1H chart:
graph after the fact? not if we use the counting which gives us an alert about the future reversal point together with the circle
YK most important
ZK classic daily standard cicle
the wrong YJ point for a bar
I had already written a few weeks ago about the importance of the angle of 354° down = 6° up... today I want to show you a technique I read in Jenkins' book.
1) In this case point A was taken with the linear graph as I saw that it is more precise
2) I draw the circle with radius OB and obtain the TOP C
I'll start by saying that I still have to master this technique.....I have to understand carefully which % of the original radius to apply... I probably have to see in the past which radius determined the maximum or minimum precisely
then I consider the radius OJ= OB (obviously) and with fibonacci I get 50% of OJ and I have the point X....at this point I draw the black circle with radius XB
my question is this: is AUDUSD random?????
I repeat the words written by THTPRO:If markets were truly random, then none of this would happen, as often as it happens
AUDUSD daily chart:
this is an experiment.... all circles and % start from the radius OB (points obtained with linear chart) determined by the usual last swing dawn AB.
the red circle determines the TOP of December 28th in the past so I assume that it must follow the red circle in the future... as well as the large white circle... let's see what happens
in the orange chart there is AUDUSD 1H ...same chart as this morning (post n 2050)...AUDUSD has fallen below the circle but is leaning against the Jenkins angular trendline (note that the primary angle is 52.5 (almost 52) the black chart is AUDUSD 5 min ... AB time count = scalping long
USDJPY 1H chart:
this is worth mentioning (even if I didn't go short and I didn't go long): USDJPY collapsed at the exact moment of the setup NOT ONLY OF THE CIRCLE but also when THE 3/4 ANGLE INTERSECTED THE HORIZONTAL FROM THE TOP.
the collapse stopped on the horizontal of the 3/4 angle
those who operate in real time like me can immediately notice it
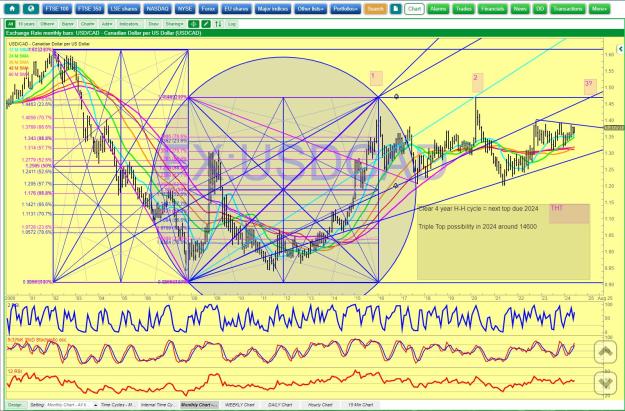
BIG monthly Triple Top right at the 78.6% retracement level of the 2002-08 bear market decline - POSSIBILITY, not guaranteed
Notice the 3 Gann Boxes and the extended angles out from key retracement levels of the box - the circles are created (not exact scale as this charting package isn't brilliant with circles)) using the diameter of the swing
Chart 1 shows 2 Gann Boxes, chart 2 shows 3 Gann Boxes - notice the levels of the extended angles, retracements etc - 57.7 and 66.6 are ratios of the CUBE
52.6 is a ratio of a golden Rectangle and 78.6 is obviously well documented as being a Fibo ratio - ALL found in the great pyramid and obviously building blocks of life & the universe