{quote} Try to test and add the Bank-Levels indicator attached to the chart for your analysis to see where the Big Banks are placing their daily orders and when they are done price moves either up or down. Good luck on your analysis. You may find obviously that at a time the big banks are placing their order for liquidity twice on the same day and price move vigorously then either on an uptrend or a downtrend. So test it first on your demo account and to check how to use this indicator. {file}
Ignored
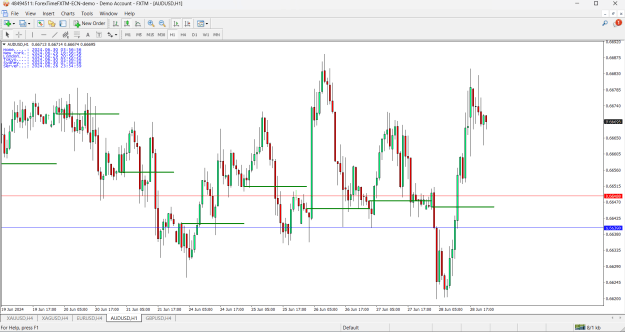
It is plotting a trendline at a specific time; for me, at UTC+5:30, it plots at 16:30 on my chart.
Is there anything special about that time?
{quote} It is plotting a trendline at a specific time; for me, at UTC+5:30, it plots at 16:30 on my chart. Is there anything special about that time? {image}
Ignored
I am on European/London time with bank-levels indicator, and on my 1-hour chart it is plotting exactly like yours. I checked and see no differences.
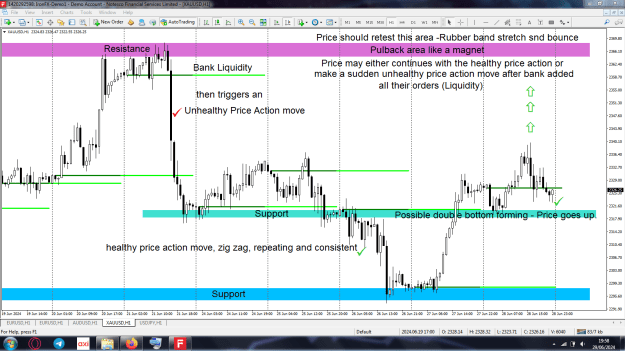
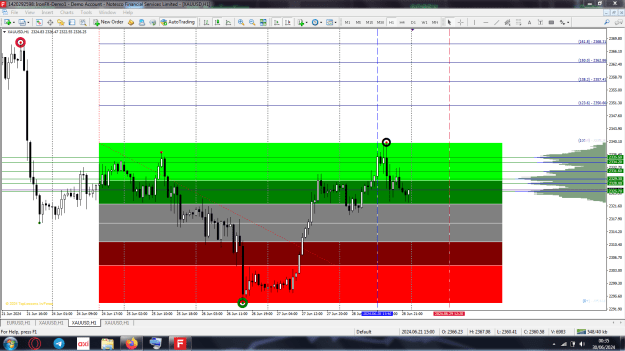
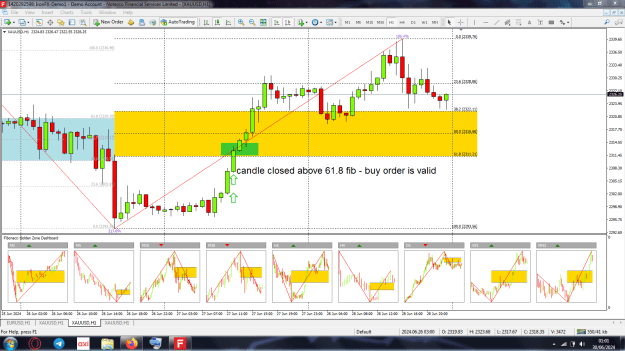
XAU USD still appears bullish, however we still have to wait for Sydney and Asia market open to see the last candle on the next Fibonacci extension formation.
Currently, it is above the Fib golden zone for the uptrend. So if the Monday candle closes above 50 fib, then a buy order is valid.
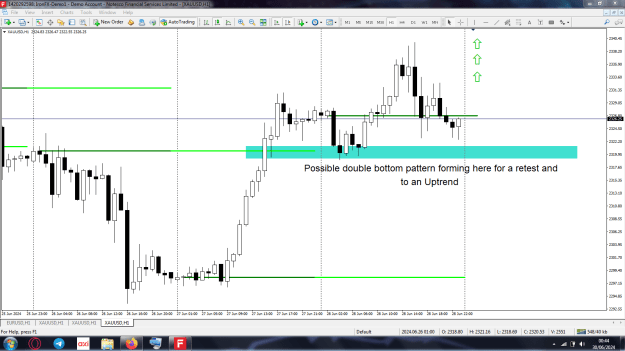
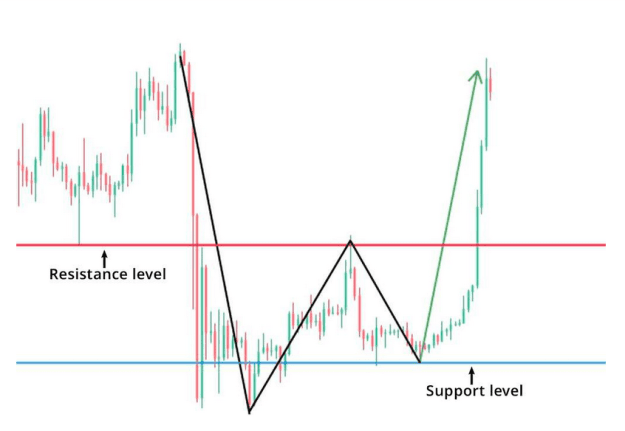
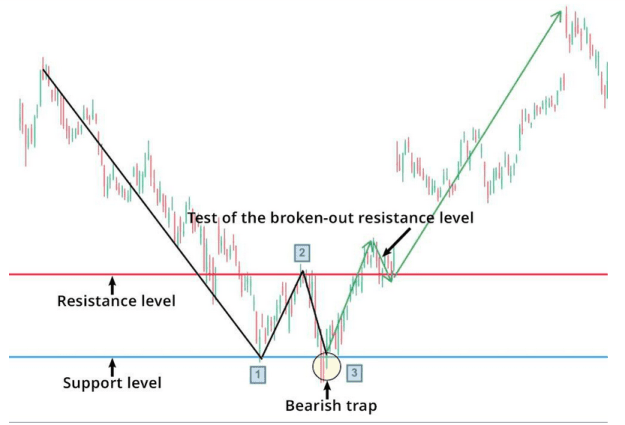
A double bottom is likely forming for the retest to the neckline and then to the uptrend.
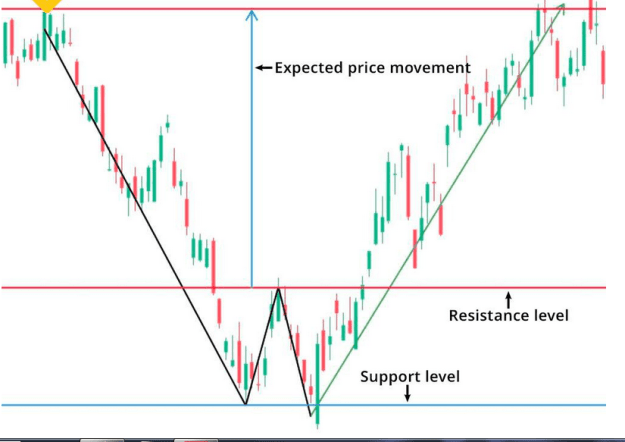
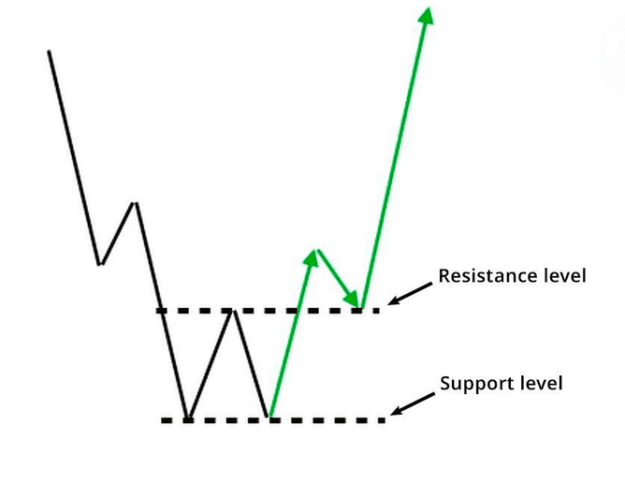
You will see a few examples of double bottom pattern below (note it is therefore not on a Gold specific chart).
Advantages
You can trade double bottom patterns in any timeframe, from M5 to D1 or W1;
Double bottom patterns often appear in the price chart;
Double bottom patterns help to define pivot levels, which gives an advantage in analysis;
you can trade double bottom patterns in Forex, cryptocurrency, stocks, bonds, and commodity market;
Double bottoms trading has clear rules to determine entry and exit points, which reduces risks.
Drawbacks
Along with double bottom patterns, there can be false breakouts and bullish traps. In particular, such things can happen in shorter timeframes, as the overall trend remains bearish in a longer timeframe. In this case, you will trade against the trend, which is not safe.
There often can form a triple bottom pattern, confusing traders. In this case, the trade is entered not correctly. To reduce the risks of losing money, one should always set stop losses.
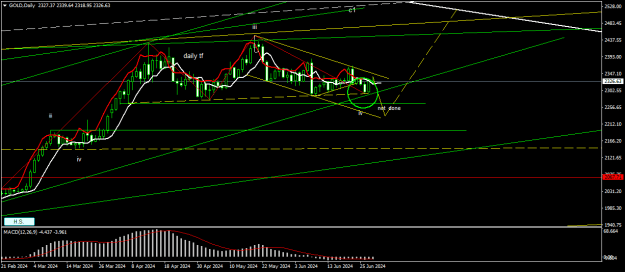
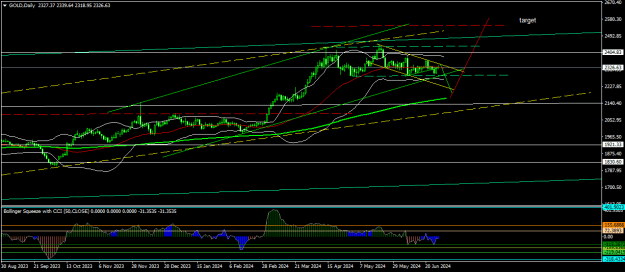
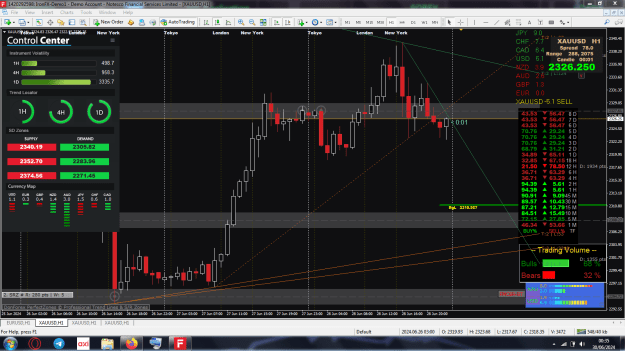
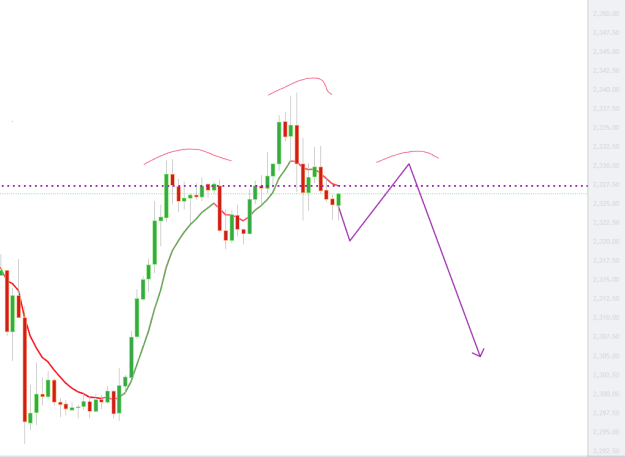
XAU USD 1 hour chart analysis and for next week with a probable price action. {image}
Ignored
H1 can also be a head and shoulders forming.
However price action in the last few hours of trading of the week, month and quarter can often be misleading (we have all 3)
in terms of what happens next. Particularly in lower time frames.
Price action at the opening of a new month can also give the wrong impression.
Joined Mar 2008
|
Status: Name real with real own way
|20,777 Posts
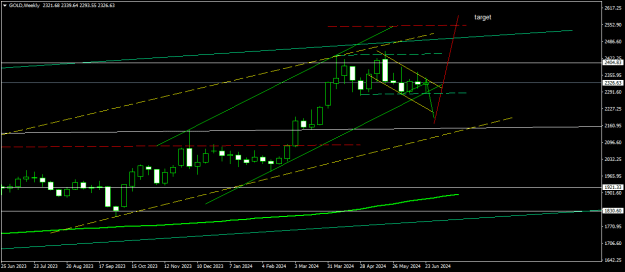
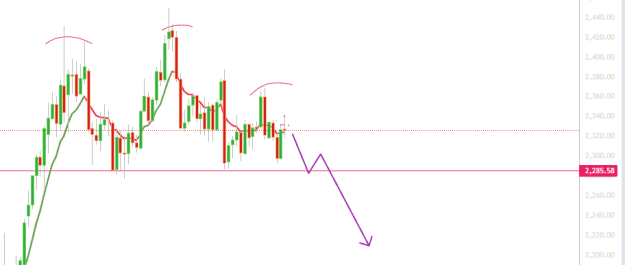
it is bull having weekly/daily tl support but as 2267 remain unbroken, better try breaks and back , so next week may continue bear. , if so before 2350 breaks and hold , breakout 2294 possible , take care , a spike up in a gap or so next ti continue down possible with market op !lets see take care. fontu
Attached Image(s) (click to enlarge)
Not understand?better not follow my analyses!doubt clearer first, risks ++
{quote} H1 can also be a head and shoulders forming. However price action in the last few hours of trading of the week, month and quarter can often be misleading (we have all 3) in terms of what happens next. Particularly in lower time frames. Price action at the opening of a new month can also give the wrong impression. {image}
Ignored
.
Excellent analysis with the price action, Axecap. May we always capture, and to gain continuously on adding those pips to grow the capital in the account.
Always protect the capital with one's risk management and set stop losses on trade. Good luck and all the best.