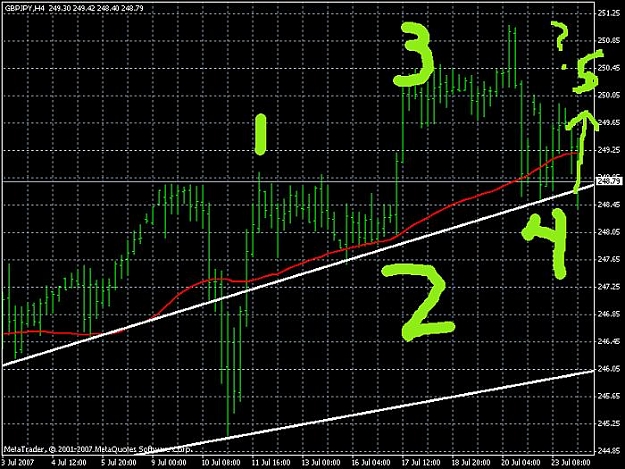
5 wave pattern, 4 can't overlap/close beyond 2 to confirm, fifth is .618, 1, 1.618, 2.618 of length of 3 above low of 4.
targets in this case:
~ 250.62
~251.90
~253.95
~ 257.28
supports the bear trap of the fouth wave in this case, with fifth wave extension projections.
Now, what to play? Look for close below wave 2, for the bearish alt, or wait for first small impulse pattern on the 1st wave of wave 5?
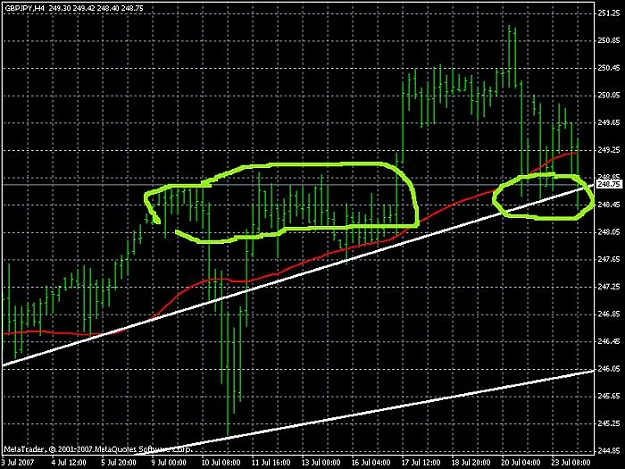
A close below the trand line, would probably invalidate the wave count in question, then test the support of the previous charts, white line. The first chart can definitely be used to identify stalling points on the lower side. How are you guys analyzing this? This is what I'm seeing, lets see where you are coming from. Cheers!
targets in this case:
~ 250.62
~251.90
~253.95
~ 257.28
supports the bear trap of the fouth wave in this case, with fifth wave extension projections.
Now, what to play? Look for close below wave 2, for the bearish alt, or wait for first small impulse pattern on the 1st wave of wave 5?
A close below the trand line, would probably invalidate the wave count in question, then test the support of the previous charts, white line. The first chart can definitely be used to identify stalling points on the lower side. How are you guys analyzing this? This is what I'm seeing, lets see where you are coming from. Cheers!
Attached Image (click to enlarge)