Having played catch up earlier this morning and taken on board more of this great thread I worked up some charts to help with my day trading of the European session in GBPJPY......WOW! The attached charts show what I mean!
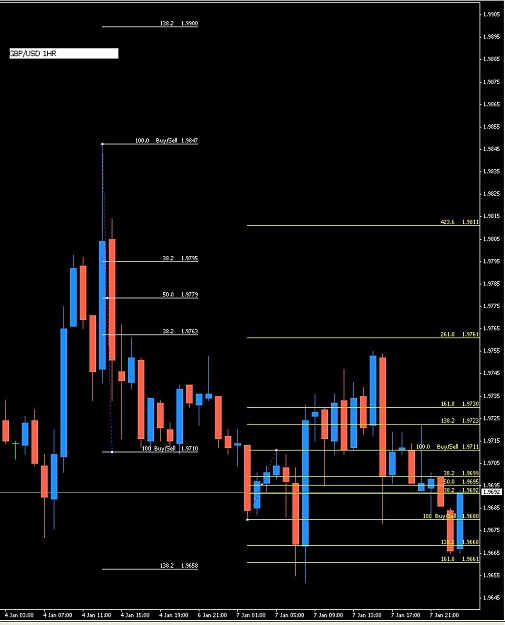
I used a 4 hr chart just to get it to fit and then transfered the yellow fibs to the 15 min and again put on another smaller range set of fibs and transfered the smaller range down to the 5 min.
I then placed a new (yellow) set of fibs onto the action from yesterdays open and noticed that price had held at the 50% line (what a surprise!!)
Just before the Frankfurt Open there was another attempted push down with an equal low at 214.32, then a higher low 15 mins after the FO - a great buy signal.....targets the 1.382 extension (-38 on the chart) at + 125 pips or the 1.618 (-62 on the chart) at + 165 pips - thanks again Skunny!
Attached Image(s) (click to enlarge)
Trading Levels with WRBs