i dont use from SL . maybe my reason is my correct distinction trend.
for example if you have gone on sell GJ and you set your SL with 100 pips.once fuji bank or Honda company for themselves need ,start for buy GJ ,maybe we will see a false upternd for GJ with 100 or 150 pips ( but in fact we know that real direction is south )but you have less by reason your SL.
Rob if i see that my position is loss and i feel there is not return , i will close my position with less.
for example i have said to you that time is nice for sell GJ(203.20) EVEN WE HAVE SEEN 203.70 . IF YOU SET YOUR SL WITH 50 PIPS FOR YOUR POSITION .........
BUT NOW I THINK THAT YOUR POSTIONS AJ and GJ are in profit
Ignored
Hussin,
Thanks for explaining. I think that your own success in anticipating the trend is a key element of your ability to feel comfortable with trading without an SL. It is excellent that you are at that stage. I am still on my journey there and am working hard to trade using higher time frames and improve my understanding of candles. I am learning every day from good people like you and reading material. I shall get where I want to be
I also understand what you mean about a sudden move caused by a Fuji or Honda trade. I know that trading JPY with small stop losses would be fatal.
I am still in both my AJ and GJ trades and both are very profitable
Thanks again for your help Hussin. My simple questions help me a lot .
Rob
Ignored
Rob , my preblem is my language English .that is very bad and this is reason for impossibility in ot establish with persons.
maybe you have not believe to my confab but i have studied total cases candlesticks with a dictionary
of course i will try for recovery my language Engilsh in the next time .
but Rob sorry for my defective explanation to you if my language English will be good in the next time (week or month )i can explanation to you better
Ignored
Hussin,
Your English is much better than my Persian so don't be sorry. I understand what you write.
I appreciate you taking the time to explain and help.
in the daily candle chart below we see a bearish harami pattern (in the this time) whether we muat will see a kabuse pattern or bearish engulfing pattern for USDYEN in the next days ???.
at first time we must wait for daily close then ...
in the daily candle chart below we have seen a Rickshaw man doji previous day.
Rickshaw man doji is a brake for previous trend a start a new trend .even we see a blue of bozu in this time after Rickshaw man doji .
attention we must wait for close daily then............
in the daily candle chart below we have seen a Rickshaw man doji previous day.
Rickshaw man doji is a brake for previous trend a start a new trend .even we see a blue of bozu in this time after Rickshaw man doji .
attention we must wait for close daily then............
|
Joined Sep 2006
|
Status: may all your Fillings be taken
|36 Posts
Great Thread Hussin!!
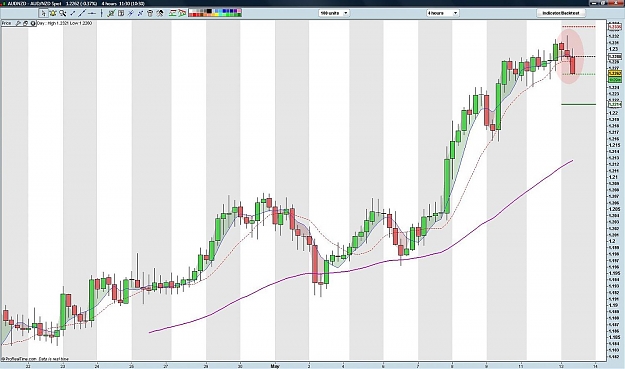
Take a look at the AUDUSD weekly; I believe between .94- and at most .96- we'll see a reversal that'll pay nicely. already a few doji lineing up at the end. (I watch up to monthly but I trade daily) ;-0
Ciao
(and my Greek is terrible; but I understand you fine) ;=p
Fez
hussin naiji your language is OK, I understand most of you are saying.
Big thank you for this thread, following it most of the time.
There are bearish classicle divergences on 4 hourly with EUR/CAD and EUR/GBP. Maybe this match with candlesticks ?
greatings
Peter
Ignored
thanks but i think you use on daily this is better then 4H
because 4h show to us only 4 hour from sentiment of market .but daily ...
meta help to peaches pls
thanks but i think you use on daily this is better then 4H
because 4h show to us only 4 hour from sentiment of market .but daily ...
meta help to peaches pls
Ignored
I prefer higher TF,too....Below daily TF errors are frequent....
Regards