I have resistance at 125.22, If broken It won't come down easily. (FEB. 22)
Ignored
I saw that too, but to my experience, R/S is not a line, its a zone, and I see there are lots of action around weekly Pivot /R/S ,and that's due to big orders waiting there, how many time have you seen a false R/S break? R at 125.22 may stop this if not 125.55 will do , even if it is temporarily we can ride 50-60 pips at least
I saw that too, but to my experience, R/S is not a line, its a zone, and I see there are lots of action around weekly Pivot /R/S ,and that's due to big orders waiting there, how many time have you seen a false R/S break? R at 125.22 may stop this if not 125.55 will do , even if it is temporarily we can ride 50-60 pips at least
Ignored
Exactly, a zone....take a look. IMHO your entry is a bit too high.
|
Commercial Member
|
Joined Feb 2009
|5,030 Posts
I posted some levels several days ago togheter with my opinion on how difficult it will be to get there #89.
The following is my short term entry and exit plan to get to those levels. (My long term view remains the same #4 #88 #201550 #186 #187 )
Went long right before the firts brake #170 and I tought it was the real one but it came back to range so I got out at BE #173. The shakeout really fooled me and I remained flat after that. So, I missed the so waited and anticipated break #128 #161 #181 but fortunally this market works both ways.
I went in short at .3735 #199 because of previous high. Then I added at daily TL which was in confluence with a AB=CD pattern #196 #201. I kept in mind .3788 #89, when we got to that level I found a beautiful butterfly #210 and went in really heavy.
I am still holding 2 positions, and my exit plan is as follow.(see chart) Price retraced 38.2% from last move which was my first target. So I got out from my first position (.3735) at BE and my heavely loaded one from .3790. Now I have two options in mind.
1. It will keep retracing upto 68.1% which will also be a retest of the triangle TL, If that is the case I will close my shorts positions and reload a long one.
2. Taking into considaration the force of this recent move 38.2% (current level) could be a decent retrace to keep going up, if this is the case one of my shorts is at BE and the other one will be -31 pips (both small positions).
|
Commercial Member
|
Joined Feb 2009
|5,030 Posts
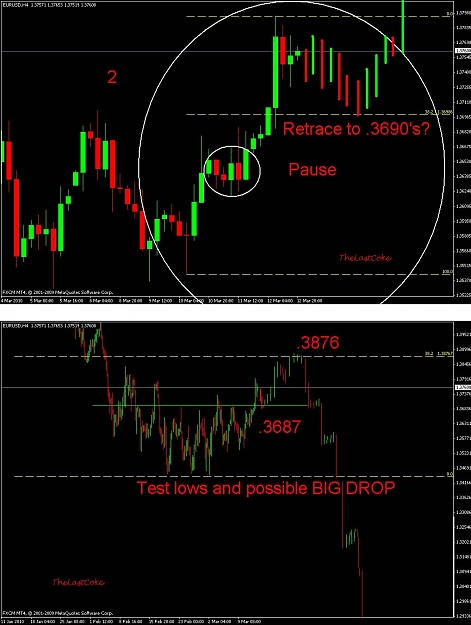
It could be heading down to 3680-90 to finally go up and test 38.3% at 3870-80.
Take a look at the bigger picture.
I plotted a fibo ret. and fan on the 2 previous big drops.
Attached Image (click to enlarge)
Notice the hits at fan and how 23.6% was used as resistance.
Attached Image (click to enlarge)
Attached Image (click to enlarge)
This recent move up seems to be ''behaving'' as the one at circle 1.
Attached Image (click to enlarge)
Attached Image (click to enlarge)
Now head to head.
Attached Image (click to enlarge)
Attached Image (click to enlarge)
I will be carefully watching PA at 38.2% (.3876) but if everything goes as plan this is what I expect: From current level it may go like this: .3687>.3876>.3440's(>400+ drop).
Mauro this is a perfect Bearish Bat formed to the pip. Check this post also #345.
GL.
Ignored
Finally this bat flew away and reached its fisrt target....this target gave birth to a 4H butterfly. From this point the butterfly can try to get away flying north retracing 38.2% from C point but eventually this giant Bat will eat it and continue its south migration to target 2.
Blue monthly TL is current battle line. Keeping an eye on that as well. If we can clearly break above it, then an up move will gain momentum. atm we're sitting under it in a critical area, so I'd like to see how SR plays out on lower TFs.
Europe open will probably give us a more clear signal on direction.
(here's a 30M view of current price relationship to blue monthly TL)