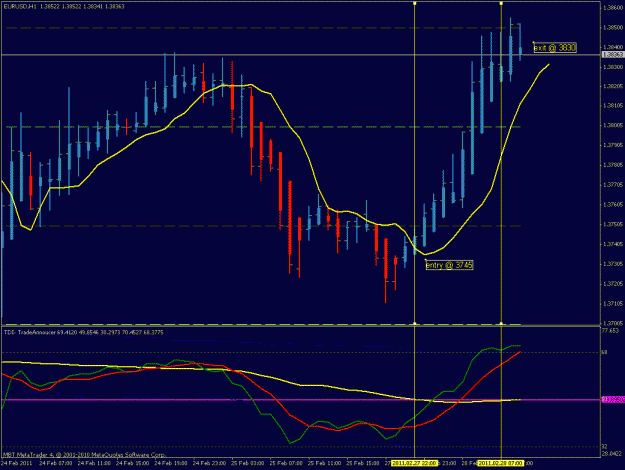
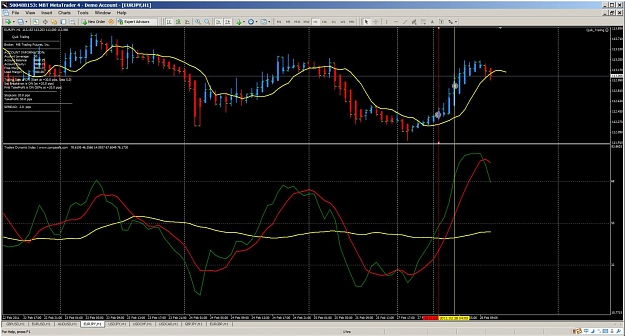
My first chart post. EU on H1 at 8:00 pm last night EST. Yellow vertical lines show candles that were entry and exit candles. Notes show entry and exit prices. For entry, candle price closed just above 5 ema, and had TDI agreement on next candle so entered. Exit when TDI was above blue line and started to flatten. Very clear what to do. Thanks Big E!!!!!!!
Attached Image (click to enlarge)