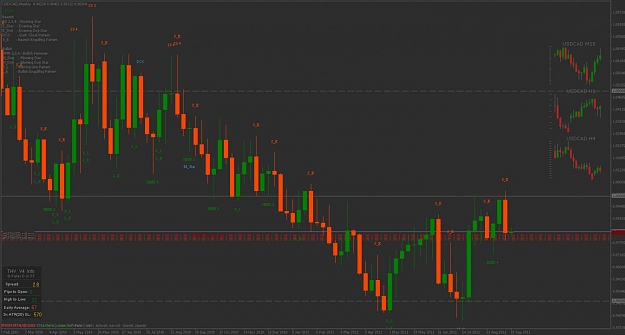
in fact i use point and figures and there was a strong resistance right belove the major line(talking about USDCHF)..and i made all my preperations in accordance to a downwards movement..and didnt even locate a BUY STOP order..because i was sure that the trend was downwards. there is something i want to ask : if u look at the candle 2011/08/07 (weekly USDCHF candle) it is a pinbar...and should it be identified as a setup candle for upwards movement (according to nomask's method ) ? I mean should we evaluate it as the beginning of a giant upwards movement? on the other hand when we look at the volumes of the weekly candles...all the increasing volumes happened on "up" bars..I think this is also a clue that the big sharks (professionals) have been making a pressure towards upside for a long time...and maybe we are right in the beginning...and most important of all this week candle ended above the major line...And it might be really good if we have a 4H pinbar next week... (and here my problem starts : its really difficult for me to find the relieble best 5M pinbar right after the 4H pinbar phase...i read and read the first posts...and still have some points which i cannot understand 100% and cannot apply in practice..hope i will overcome it with experience... and next week AUDJPY , GBPCHF , EURJPY , USDCHF , and maybe USDCAD (i just closed my order with 70 pips profit because the market moved so fast and i wanted to be sure of my profit..and now i feel regretful)... plz share ur ideas with me about the pairs i mentioned above...i just want to "understand" this method...
Imagination rules the world ...