I am starting this thread out of frustration with my inability to implement what I was reading about S/D zones.
It is my understanding that when price returns to a S/D zone it would, in most likelyhood retrace.
To confirm a trade in the direction of the retrace, one would use candle formations or indicators (to a lesser degree)
When I watch some of the charts posted, these levels seem to be very obvious and a trade should be easy to implement.
Problem is that in real life (live) trading, the moves are not so obvious.
Another issue that I have is with the explanations given.
They all explain an event that occured, thus, any explanation would be valid.(i.e. "price turned down at SUPPLY because there were no more buyers". Isn't it obvious that price turned down because there were no more buyers?
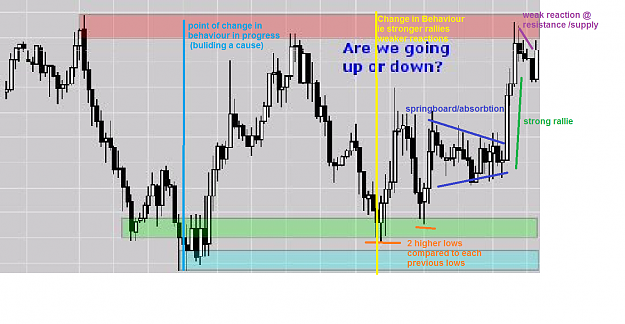
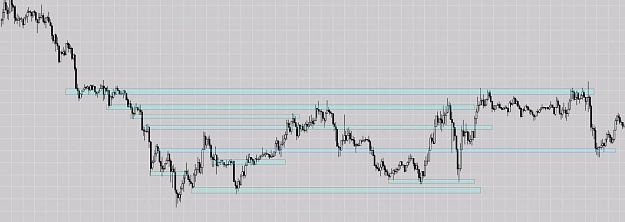
I will post some charts with zones and indicate my expectation of the
impeding move.
Please comment whether the zones are valid or not and please reply to the question(s) in the charts.
Thank you
Gabe
It is my understanding that when price returns to a S/D zone it would, in most likelyhood retrace.
To confirm a trade in the direction of the retrace, one would use candle formations or indicators (to a lesser degree)
When I watch some of the charts posted, these levels seem to be very obvious and a trade should be easy to implement.
Problem is that in real life (live) trading, the moves are not so obvious.
Another issue that I have is with the explanations given.
They all explain an event that occured, thus, any explanation would be valid.(i.e. "price turned down at SUPPLY because there were no more buyers". Isn't it obvious that price turned down because there were no more buyers?
I will post some charts with zones and indicate my expectation of the
impeding move.
Please comment whether the zones are valid or not and please reply to the question(s) in the charts.
Thank you
Gabe
Attached Image

Every rule has an exception. Except for this one.