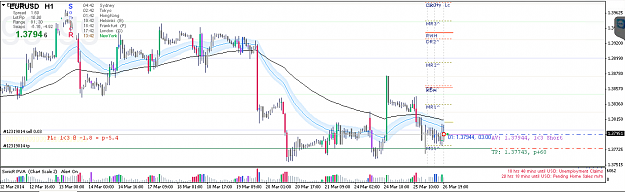
"PVSRA is indicating the MMs to be bulls or bears.
Finally, look at the M15 chart. So easy it is to see that yesterday the bear
MMs hiked the price above the whole number and then the real trading
started!"
THA you do a very good job. I am a teacher too and I know there is a
difference between to trade and teach to trade. But while teaching your
knowledge becomes clearer and so your trading.
I was reading post 1 and all pfd over and over. I understand Sonic System
with dragon H L ect very well. Still I have problems with volume. I know all
the theory but I find it difficult in praxis to determine if MMs are bulls
or bears. I see often opposite signals. The key is in the 1m chart right? I
have problems to see it. The volume is a completely other story then PA.
May you post some clear examples? to see when the volume is the key and
when not.
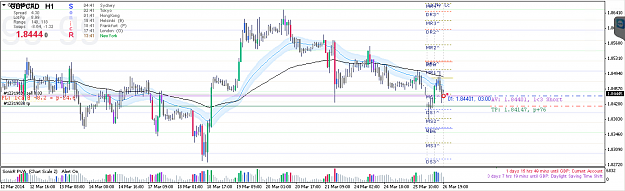
example USDCAD
m15
I marked an area with high volume in yellow.
high volume above 750, is it open shorts (if so why here and not higher) or is it closing shorts that should be under 750 (if so the bears coming to the end?)
or is it pushing down?

m5
mixed I see also green volume
some volume above some under 750

m1
mixed
red and green volume in the middle of 1750 and 2000
red volume above 750 but later also under and green too

I have no idea how to interpret this really. Thank you for your help.
Finally, look at the M15 chart. So easy it is to see that yesterday the bear
MMs hiked the price above the whole number and then the real trading
started!"
THA you do a very good job. I am a teacher too and I know there is a
difference between to trade and teach to trade. But while teaching your
knowledge becomes clearer and so your trading.
I was reading post 1 and all pfd over and over. I understand Sonic System
with dragon H L ect very well. Still I have problems with volume. I know all
the theory but I find it difficult in praxis to determine if MMs are bulls
or bears. I see often opposite signals. The key is in the 1m chart right? I
have problems to see it. The volume is a completely other story then PA.
May you post some clear examples? to see when the volume is the key and
when not.
example USDCAD
m15
I marked an area with high volume in yellow.
high volume above 750, is it open shorts (if so why here and not higher) or is it closing shorts that should be under 750 (if so the bears coming to the end?)
or is it pushing down?
Attached Image (click to enlarge)
m5
mixed I see also green volume
some volume above some under 750
Attached Image (click to enlarge)
m1
mixed
red and green volume in the middle of 1750 and 2000
red volume above 750 but later also under and green too
Attached Image (click to enlarge)
I have no idea how to interpret this really. Thank you for your help.
Scan all 28 Forex pairs with ONE chart... Currency Strength28 Indicators