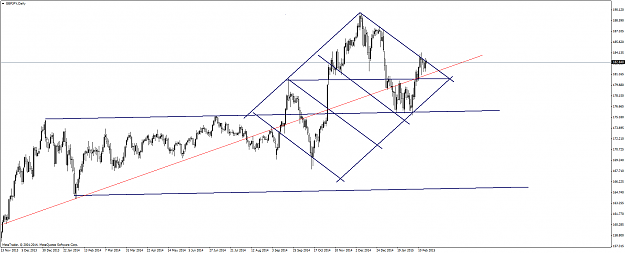
DislikedEach to their own, but from where I sit, this thing's trying its hardest to break up from the mother of all continuation patterns. {image} Whether it succeeds without falling way back in is another matter. Additionally, how far it might get is the unknown - but right now it still has the CHANCE of getting up - with a favourable wind and a few minor deities for good luck. The red line represents a literal line in the sand that was almost impossible for the general market to break (since 2011). Until that line broke, GJ was a fully paid up member...Ignored
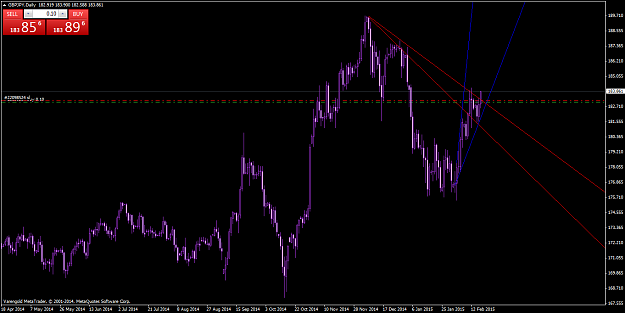
At the same time, based on what I see in your graph, the longer it dawdles there, the higher the chances of prices dipping goes, which goes in hand with my previous assessment. I think the potential lynchpin for this pattern would be the BOJ conference today-problem is, I still can't get even a general timeframe as to when the conference will be announced, not even on the BOJ website.
Any ideas, people? I'm hoping we don't get a double slam with U.K. data and BOJ conference being announced within just a couple hours of one another. That'll send markets rolling, and potentially hit my SLs.
Also, if it breaks the current 50% fib support, we only have one more real support before hitting 181 becomes almost given, save for an outlier event.